Mmwave Demo Visualizer的Range Profile数据是如何得到的?

Other Parts Discussed in Thread: AWR1843

各位TI的工程师们

我想请问一下Mmwave Demo Visualizer里的Range Profile for zero Doppler图中的纵坐标Relative Power是什么意思呢?它是如何得到的呢?它是不是就是直接将ADC的采样值进行FFT后得到的?以及雷达前端的混频器在信号幅度上是否有额外的处理?

Thanks

  • 你好,
    直接将ADC的采样值进行FFT后得到的。
    但是运算,加窗均有可能会有增益。不完全等效于一个单纯FFT。
  • Wesley

    感谢您的回复!

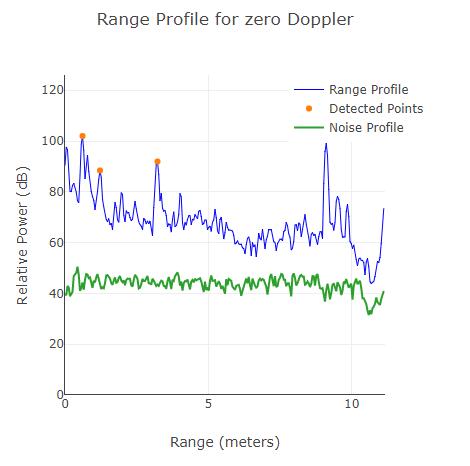
    在Mmwave Demo Visualizer的user guide中提到如下这部分(3.3 Range Profile)

    The range and noise profile sent by the mmWave device is compensated for all the
    1D and 2D FFT gains and the incoherent combining gain across the antennas, as per the mmWave demo
    processing chain, before plotting.

    是否可以认为评估板发到主机处的数据已经补偿矫正过中间的额外增益,而是单纯的对ADC采样数据的FFT呢?

    以及,在哪里可以看到AWR1843芯片雷达前端部分混频器的具体原理呢?我想要了解中频信号的幅值与发送的chirp之间的关系。

    Thanks