This thread has been locked.
If you have a related question, please click the "Ask a related question" button in the top right corner. The newly created question will be automatically linked to this question.
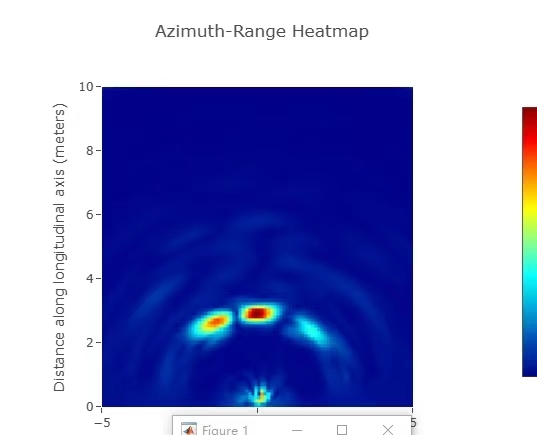
我使用的是SDK3.5的xwr16xx的demo,在demo visualizer中的角度距离热图是这样的
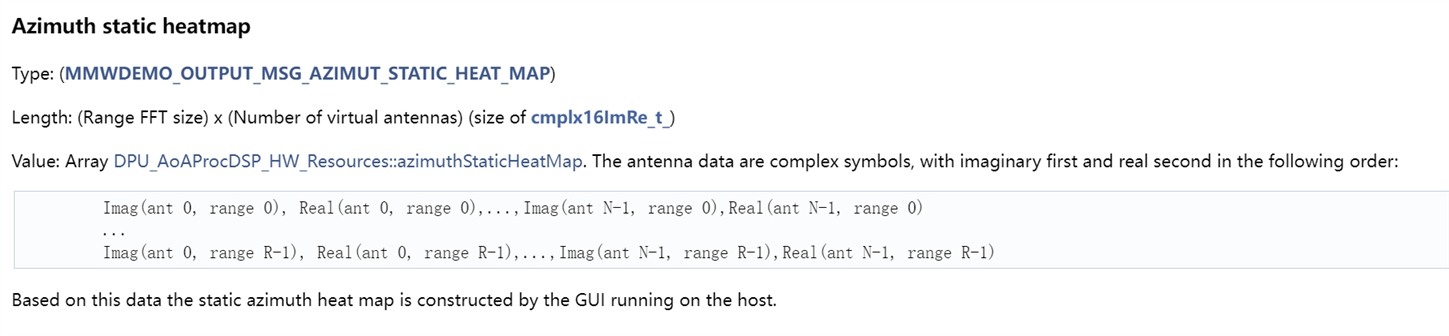
Index中介绍的角度距离图的数据排列是:
每个数据为复数形式,请问如何还原成热图呢,我是四发二收。
需要下载offline版本的mmwave demo visualizer,查看生成热图的源码,请看下面的帖子。https://dev.ti.com/gallery/search/mmwave%20demo%20visualizerhttps://e2e.ti.com/support/sensors-group/sensors/f/sensors-forum/975332/awr1642boost-how-to-calculate-azimuth-heat-map