

As showed, R is set 140k which is connected to Rs5, and the AC Transfer characteristc results is showed below:
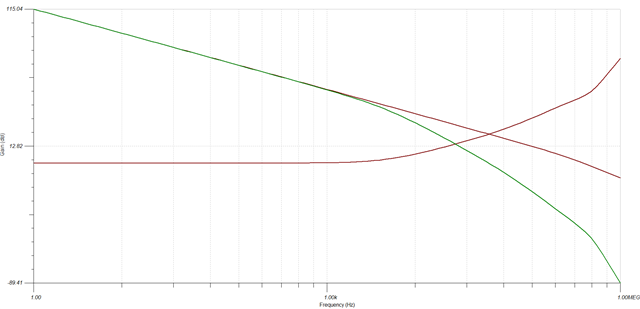
But when we sweep this R, the result at 140k(red line) is different with the first simulation result.
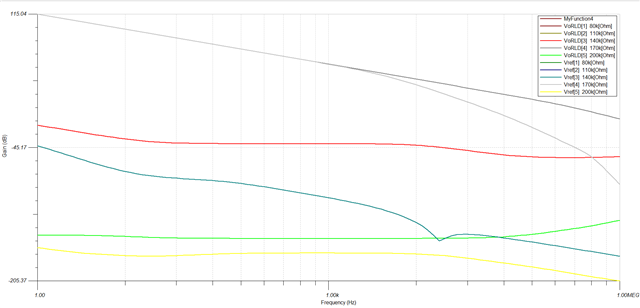
As showed, R is set 140k which is connected to Rs5, and the AC Transfer characteristc results is showed below:
But when we sweep this R, the result at 140k(red line) is different with the first simulation result.
