This thread has been locked.
If you have a related question, please click the "Ask a related question" button in the top right corner. The newly created question will be automatically linked to this question.
Part Number: TAS2564
您好,
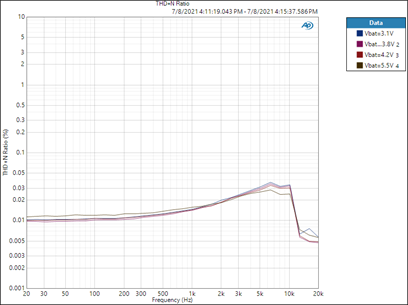
我在进行THD+N vs frequency 的测试时得到的结果为下图:
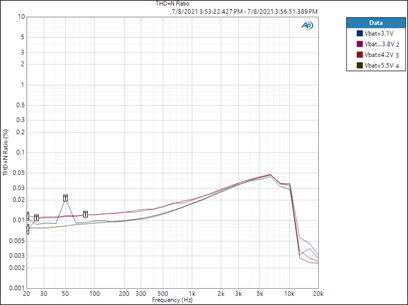
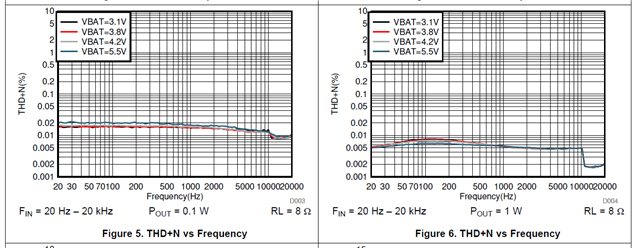
在芯片手册中对应的曲线为下图:
我想请教一下为什么在我测的结果中会出现先增大后减小的趋势,在5k-10k之间出现一个尖峰,而芯片手册中没有这个变化趋势。
请问这个尖峰出现的原因可能是什么呢?这个测试结果是否是可信的呢?
您好,不知您的测试过程是什么样的, 参考这篇关于音频各项性能测试的指南手册,其中4.2部分的介绍就是THD+N VS Frequency的测试步骤:
https://www.ti.com/lit/an/sloa068a/sloa068a.pdf
您好我是按照您给的文档利用AP进行测试的
您好,抱歉回复晚了,datasheet中的THD+N 的曲线是使用PPC3-MB板子上的D2S filter绘制的,如datasheet 第7节所述。 所以这是您这边测试结果和datasheet中有差异的原因,但您的测试结果也是可信的。
如果您计划使用D2S filter进行测试,请考虑都filter的输出比实际扬声器的输出功率要小,您需要跟踪AP不同的通道上的输出功率和失真。