This thread has been locked.
If you have a related question, please click the "Ask a related question" button in the top right corner. The newly created question will be automatically linked to this question.
Part Number: OPA1622
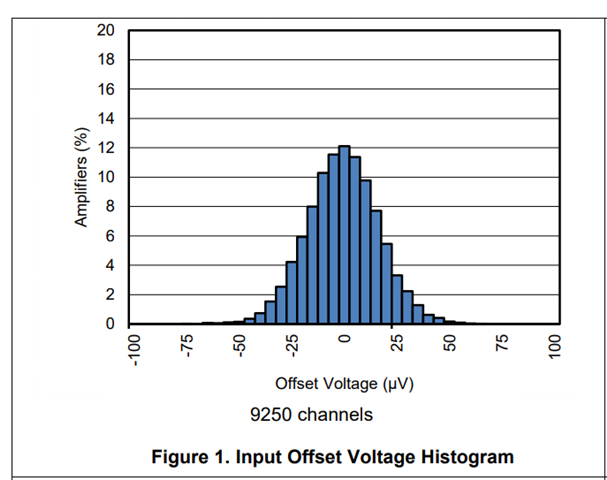
如题,前面表格里TYP是±100μv,Figure 3.里面也是可以目测黑线从-100μv开始的,唯独Figure 1.的数值相对少很多?
您好,FIgure 1也是从-100uV~100uV的范围。这是一个正态分布图,可以看到均值为0,在0uV两边呈现对称分布,分别向两侧分布,离均值越远,值越趋近于0.