This thread has been locked.
If you have a related question, please click the "Ask a related question" button in the top right corner. The newly created question will be automatically linked to this question.
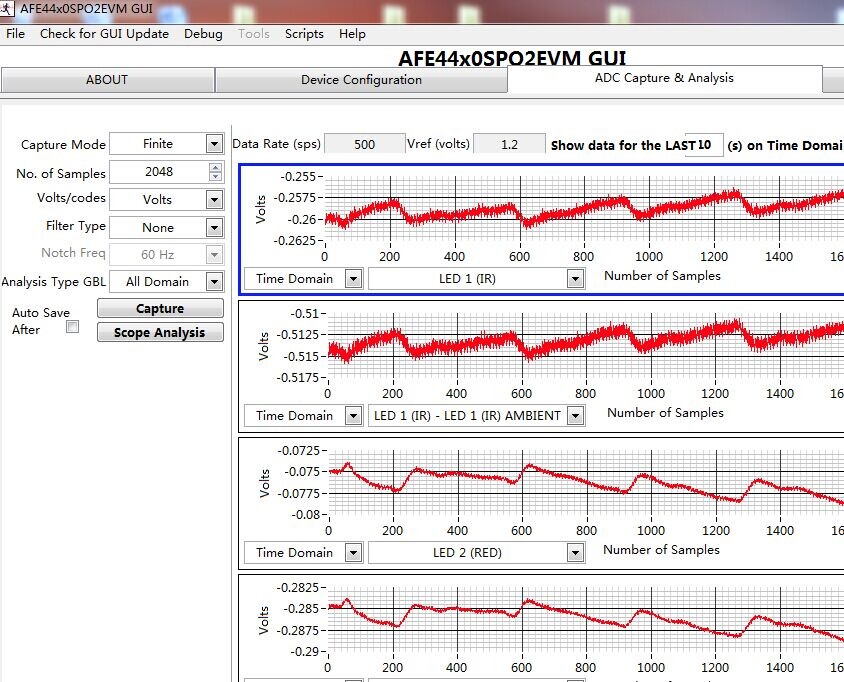
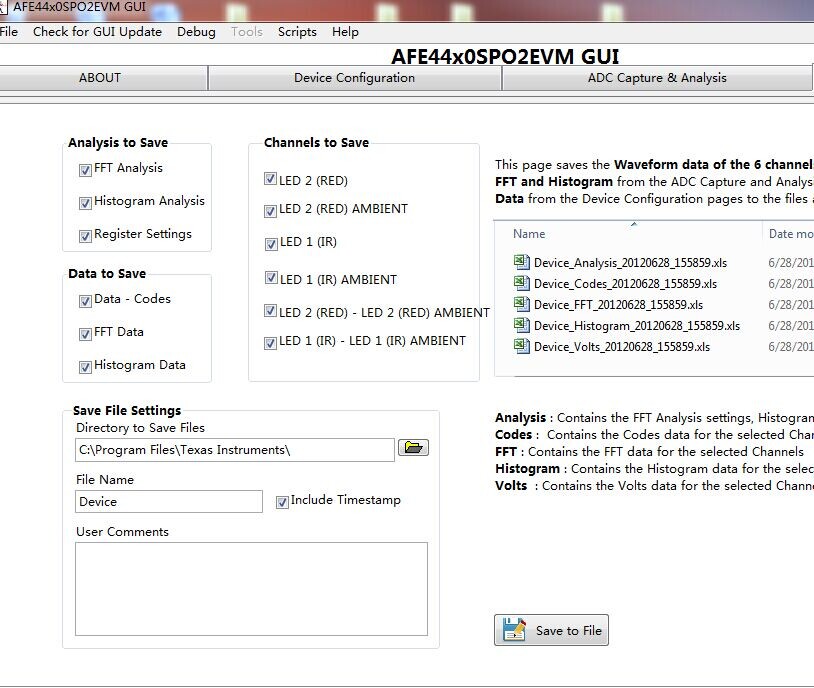
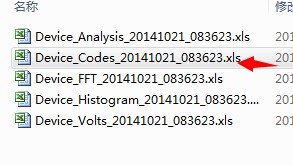
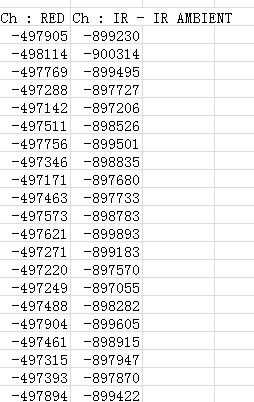
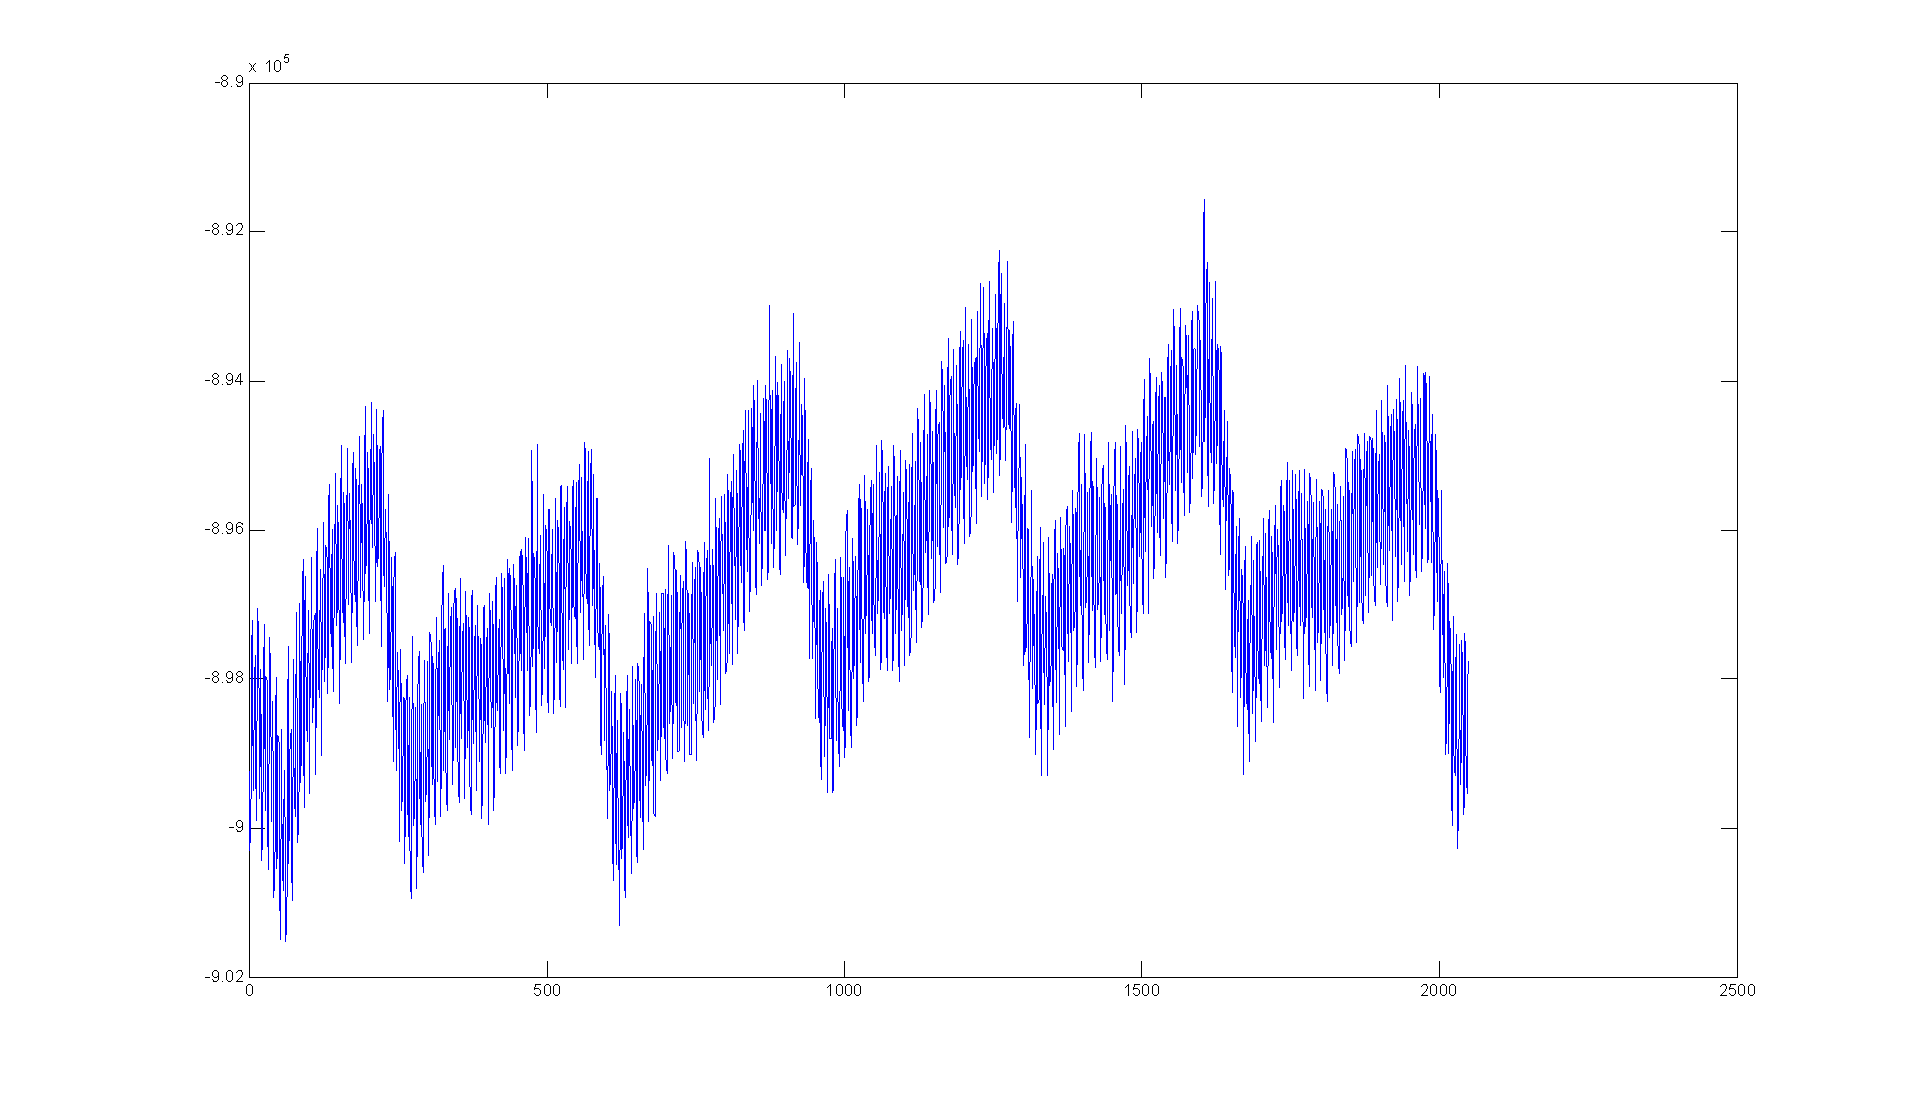
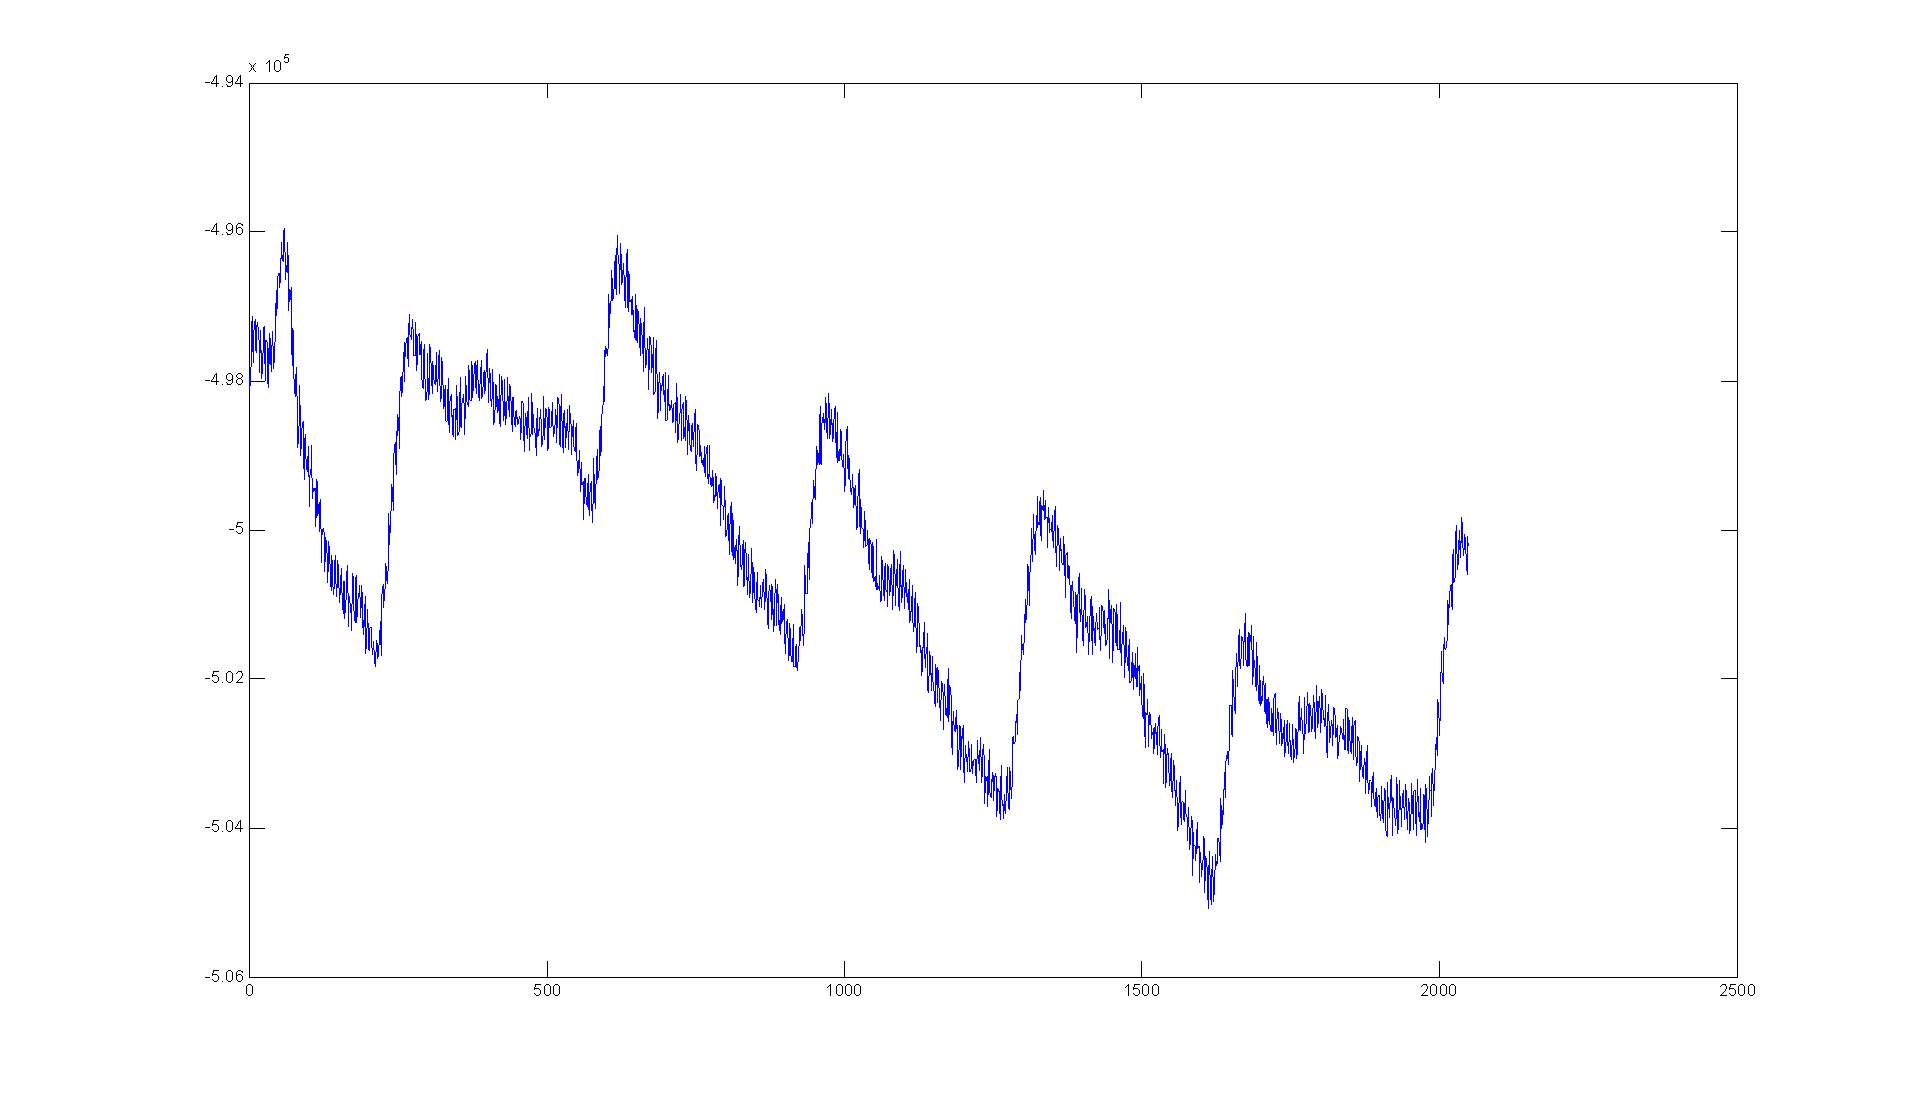
大家好!很抱歉又打扰大家了!在测量反射式波形的时候,我在GUI上得到的值这样的波形,然后我在SAVE界面保存了数据,到相应路径找到存放red-ambient和IR-ambient的Excel,将这两列数据用MATLAB显示出来,为什么我MATLAB显示的波形和GUI界面显示的波形差异这么大?请问这是怎么回事呢?谢谢!
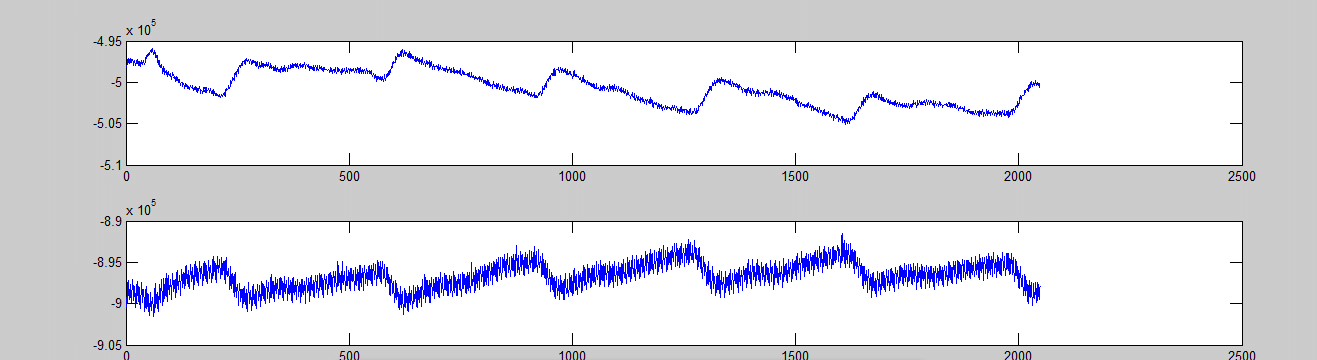
GUI的波形:
不好意思大家,是我自己的问题,是我MATLAB使用不熟练造成的,不好意思了。。。