This thread has been locked.

If you have a related question, please click the "Ask a related question" button in the top right corner. The newly created question will be automatically linked to this question.

[参考译文] PROCESSOR-SDK-J721S2:Edgeai-tiovx-apps RTOS (v9.2)教程图

Guru**** 2013490 points
请注意,本文内容源自机器翻译,可能存在语法或其它翻译错误,仅供参考。如需获取准确内容,请参阅链接中的英语原文或自行翻译。

https://e2e.ti.com/support/processors-group/processors/f/processors-forum/1387814/processor-sdk-j721s2-edgeai-tiovx-apps-rtos-v9-2-tutorials-graphs

器件型号:PROCESSOR-SDK-J721S2

工具与软件:

您好!

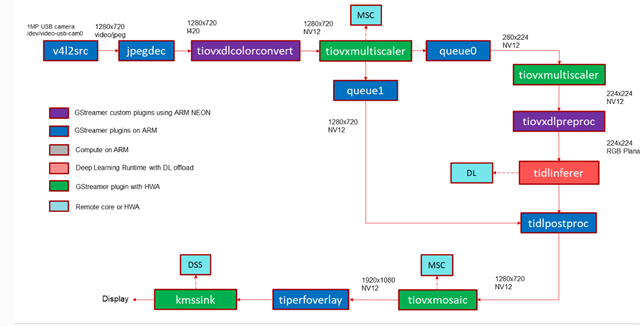
我正在 v9.2 SDK 上运行 edgeai-tiovx-apps RTOS 教程。 我很想了解如何可视化这些教程的 openvx 图(类似于  基于 GStreamer 的流水线的 edgeai_dataflows)、以查看 openvx 中的连接节点。

例如、对于 single_input_multi_inference 教程、我想了解如何将这些节点连接在一起以形成最终的推理图。 我查看 Edge-AI-TIOVX-Apps-reference 指南 、该指南提供了一些有关如何在 TIOVX 中生成图形的一般信息。 但是、我找不到 每个教程的图表。   

是否有任何方法可以将这些图表可视化(至少针对教程)?

谢谢!

Ahmed