This thread has been locked.

If you have a related question, please click the "Ask a related question" button in the top right corner. The newly created question will be automatically linked to this question.

[参考译文] AWR6843AOP:在毫米波可视化工具中提取距离曲线值时出现问题

Guru**** 2463330 points


请注意,本文内容源自机器翻译,可能存在语法或其它翻译错误,仅供参考。如需获取准确内容,请参阅链接中的英语原文或自行翻译。

https://e2e.ti.com/support/sensors-group/sensors/f/sensors-forum/1488244/awr6843aop-issue-with-extracting-range-profile-values-in-mmwave-visualizer

器件型号:AWR6843AOP

工具与软件:

您好、TI 专家:

我当前使用 Python 从毫米波可视化工具中提取距离曲线值。
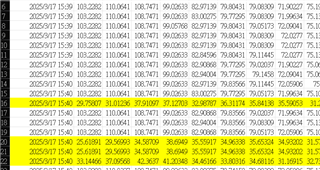
但是、我注意到、在读取数据100秒时、会出现一些异常值。 这种情况是否正常?
当我采集的值小于预期值时、这意味着什么?
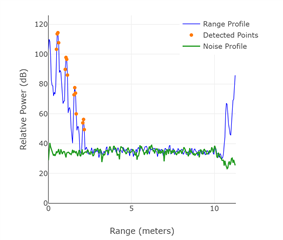


BR、
文森特

  • 请注意,本文内容源自机器翻译,可能存在语法或其它翻译错误,仅供参考。如需获取准确内容,请参阅链接中的英语原文或自行翻译。

    您好、Vincent:

    黄色突出显示的线看起来像噪声曲线。  您的 python 脚本是否具有传播距离曲线和噪声曲线的某种问题?

    此致!

    Zigang