请注意,本文内容源自机器翻译,可能存在语法或其它翻译错误,仅供参考。如需获取准确内容,请参阅链接中的英语原文或自行翻译。
器件型号:IWR6843AOPEVM 您好!
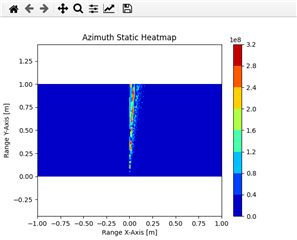
我一直在尝试在 Python 中绘制方位角距离热图、 到目前为止、我看到这个线程解释了如何在 Matlab 中实现它、但到目前为止还没有成功地翻译 python 中的这段代码。 我正在解析 TLV 这样:
    a = f"{int(tlv_length//4)}i"
    data = np.array(struct.unpack(a, data))
    i = data[1::2]
    q = data[::2]
    data = q
    data = data.reshape((8, 128))
在与 MATLAB 中类似的代码段中使用数据变量:
    if data.shape[0] % 2 != 0:
        raise ValueError("The number of rows in 'data' must be even.")

    Q = data
    NUM_ANGLE_BINS = np.shape(Q)[0]
    theta = np.degrees(np.arcsin(np.linspace(-NUM_ANGLE_BINS/2 + 1, NUM_ANGLE_BINS/2 - 1, NUM_ANGLE_BINS) * (2/NUM_ANGLE_BINS)))
    print(theta.shape)
    range_bins = 1.0
    posX = np.outer(range_bins, np.sin(np.radians(theta)))
    posY = np.outer(range_bins, np.cos(np.radians(theta)))
    xlin = np.linspace(-np.floor(np.max(range_bins)), np.ceil(np.max(range_bins)), 200)
    ylin = np.linspace(0, np.ceil(np.max(range_bins)), 200)
    X, Y = np.meshgrid(xlin, ylin)

    QQ = fftshift(np.abs(Q))
    print('posXY', posX.flatten().shape, posY.flatten().shape)
    try:
        Z = griddata((posX.flatten(), posY.flatten()), QQ, (X, Y), method='nearest')
    except Exception as e:
        print(e)

    fig, ax = plt.subplots()
    try:
        hAzimuthHeatmapPlot = ax.contourf(X, Y, Z, cmap='jet')
    except Exception as e:
        print(e)

    ax.axis('equal')
    ax.set_xlim([-np.ceil(np.max(range_bins)), np.ceil(np.max(range_bins))])
    ax.set_ylim([0, np.ceil(np.max(range_bins))])
    ax.set_xlabel('Range X-Axis [m]')
    ax.set_ylabel('Range Y-Axis [m]')
    titleStr = 'Azimuth Static Heatmap'

    ax.set_title(titleStr)
    fig.colorbar(hAzimuthHeatmapPlot)


    plt.show()
但结果并不是预期的结果、我很难理解如何做到这一点。