This thread has been locked.

If you have a related question, please click the "Ask a related question" button in the top right corner. The newly created question will be automatically linked to this question.

[参考译文] AWRL6432BOOST:可视化工具未运行、终端持续崩溃

Guru**** 2540720 points
Other Parts Discussed in Thread: AWRL6432BOOST, AWRL6432, CCSTUDIO, DCA1000EVM, MMWAVE-L-SDK

请注意,本文内容源自机器翻译,可能存在语法或其它翻译错误,仅供参考。如需获取准确内容,请参阅链接中的英语原文或自行翻译。

https://e2e.ti.com/support/sensors-group/sensors/f/sensors-forum/1350944/awrl6432boost-visualizer-not-running-terminal-keeps-crashing

器件型号:AWRL6432BOOST
主题中讨论的其他器件: AWRL6432DCA1000EVMMMWAVE-L-SDK、CCStudio

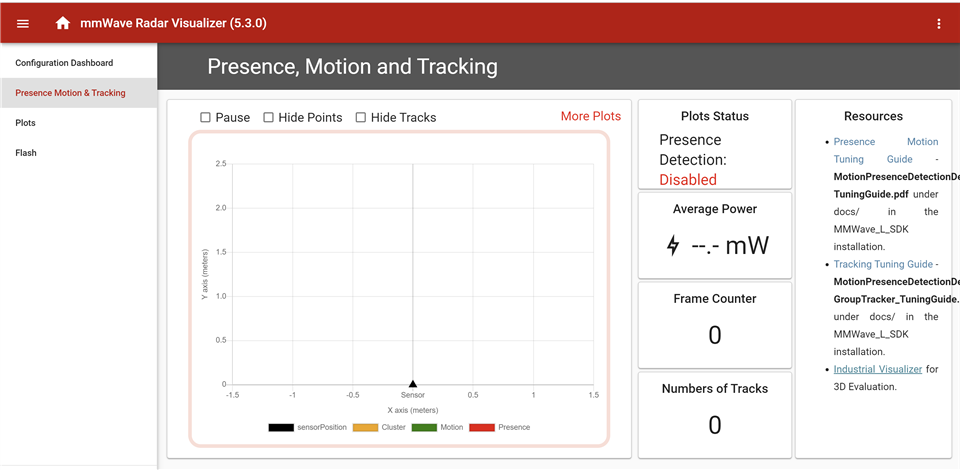
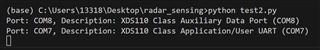
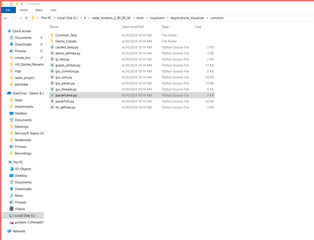
我下载了 mmWave_L_SDK_05_03_00_02-Windows 和 ti_xds110_setup_7.0.100.1_windows。 但我仍然无法在以下文件位置运行低功耗 Visulaizer:"c:\ti\mmwave_L_SDK_05_03_00_02\tools\visualizer\Low_power_visualizer_5.3.0.0"。 我甚至无法诊断此问题、因为每次双击 visualizer.exe 时、终端打开并立即崩溃、因此我无法捕捉到错误。

  • 请注意,本文内容源自机器翻译,可能存在语法或其它翻译错误,仅供参考。如需获取准确内容,请参阅链接中的英语原文或自行翻译。

    好的、没关系。 必须以管理员身份运行。 但现在、可视化工具的配置仪表板部分中没有任何按钮可以正常工作、状态运动和跟踪部分看起来像这样:  

    为什么这些图被禁用以及如何启用它们?

  • 请注意,本文内容源自机器翻译,可能存在语法或其它翻译错误,仅供参考。如需获取准确内容,请参阅链接中的英语原文或自行翻译。

    您好!

    您是否能够使用可视化工具刷写器件?

    谢谢。

    克林顿

  • 请注意,本文内容源自机器翻译,可能存在语法或其它翻译错误,仅供参考。如需获取准确内容,请参阅链接中的英语原文或自行翻译。

    是的、我看到过闪存部分。 问题是在配置仪表板中选择的默认端口。 那么、可视化工具现在可以工作。 是否不知道如何将原始数据发送到该可视化工具?

  • 请注意,本文内容源自机器翻译,可能存在语法或其它翻译错误,仅供参考。如需获取准确内容,请参阅链接中的英语原文或自行翻译。

    您好!

    很高兴你能够解决这个问题。 您是否关注此开箱即用示例?

    https://dev.ti.com/tirex/content/radar_toolbox_1_30_01_03/source/ti/examples/Presence_and_Motion_Detection docs/Presence_and_motion_users_guide.html

    它链接到我们有关输出数据的文档:

    https://dev.ti.com/tirex/explore/content/radar_toolbox_1_30_01_03/docs/software_guides/Understanding_UART_Data_Output_Format .html

    谢谢。

    克林顿

  • 请注意,本文内容源自机器翻译,可能存在语法或其它翻译错误,仅供参考。如需获取准确内容,请参阅链接中的英语原文或自行翻译。

    根据该文档以 python 语言编写了以下代码:

    import serial
    import serial.tools.list_ports as s
    import serial
    available_ports = list(serial.tools.list_ports.comports())
    for port, desc, hwid in available_ports:
    print(f"Port: {port}, Description: {desc}")
    
    # Configure the UART connection
    uart_port = 'COM7' # Replace with the correct port for your system
    
    uart_baudrate = 9600 # Set the baudrate to match the configuration of the evaluation board
    
    # Open the UART connection
    ser = serial.Serial(uart_port, uart_baudrate)
    
    # Enable the desired data outputs using CLI commands
    # Replace the following commands with the specific configuration you need
    cli_commands = [
    'sensorConfig --enabled=true',
    'rangeProfile --enabled=true',
    'detectedPoints --enabled=true',
    # Add more commands for other data outputs you want to enable
    ]
    
    for command in cli_commands:
    ser.write((command + '\n').encode())
    response = ser.readline()
    print(response)
    
    # Read and process the data
    while True:
    # Read a line of data from the UART connection
    data = ser.readline().decode().strip()
    
    # Process the data based on the data types you enabled
    # Extract the desired raw data from the received data
    
    # Example: If you enabled range profile, parse and process the range profile data
    if 'MMWDEMO_OUTPUT_MSG_RANGE_PROFILE' in data:
    range_profile_data = data.split(':')[1].strip()
    # Process the range profile data as needed
    
    # Example: If you enabled detected points, parse and process the detected points data
    if 'MMWDEMO_OUTPUT_MSG_DETECTED_POINTS' in data:
    detected_points_data = data.split(':')[1].strip()
    # Process the detected points data as needed
    
    # Add more processing logic for other enabled data types
    
    # Close the UART connection when done
    ser.close()

    这是我获得的输出、随后它挂起。 有什么想法我做错了什么?


  • 请注意,本文内容源自机器翻译,可能存在语法或其它翻译错误,仅供参考。如需获取准确内容,请参阅链接中的英语原文或自行翻译。

    是代码不是获取数据的最佳方式。 如果我想使用原始数据以便在幕后发生某些触发或关闭、您有什么建议?

  • 请注意,本文内容源自机器翻译,可能存在语法或其它翻译错误,仅供参考。如需获取准确内容,请参阅链接中的英语原文或自行翻译。

    您好!

    如果你想在 python 中工作,我建议看一看"工业"可视化工具。 它用 python 语言编写、并且所有源都可以在 Radar Toolbox 中获得。 您可以在以下位置找到该手册。

    C:Industrial_Visualizer

    谢谢。

    克林顿

  • 请注意,本文内容源自机器翻译,可能存在语法或其它翻译错误,仅供参考。如需获取准确内容,请参阅链接中的英语原文或自行翻译。

    我没有看到雷达工具箱文件夹只是 MMWAVE_L_SDK... 和 xds110

  • 请注意,本文内容源自机器翻译,可能存在语法或其它翻译错误,仅供参考。如需获取准确内容,请参阅链接中的英语原文或自行翻译。

    我终于明白了你现在的意思、不、我无法快速展示

  • 请注意,本文内容源自机器翻译,可能存在语法或其它翻译错误,仅供参考。如需获取准确内容,请参阅链接中的英语原文或自行翻译。

    我终于理解了您现在所说的内容、但我无法快速

  • 请注意,本文内容源自机器翻译,可能存在语法或其它翻译错误,仅供参考。如需获取准确内容,请参阅链接中的英语原文或自行翻译。

    您好!

    您能详细说明一下您具体指的是什么吗? 您关注的是什么文档、所处的步骤是什么、您尝试刷写什么?

    谢谢。

    克林顿

  • 请注意,本文内容源自机器翻译,可能存在语法或其它翻译错误,仅供参考。如需获取准确内容,请参阅链接中的英语原文或自行翻译。

    实际上、我现在可以讨论的问题是波特率。 但是我没有工业可视化工具

    https://www.ti.com/tool/download/RADAR-TOOLBOX/2.00.00.06 

    我看到有一个下载链接、但我看不到任何可下载的内容

  • 请注意,本文内容源自机器翻译,可能存在语法或其它翻译错误,仅供参考。如需获取准确内容,请参阅链接中的英语原文或自行翻译。

    尝试从这里转至、然后从那里打开工具箱。 一个3点菜单按钮将为您提供下载选项。

    https://dev.ti.com/tirex/explore/node?placeholder=true 

  • 请注意,本文内容源自机器翻译,可能存在语法或其它翻译错误,仅供参考。如需获取准确内容,请参阅链接中的英语原文或自行翻译。

    这就是您所指的:

    import sys
    import os
    
    # add common folder to path
    # sys.path.insert(1, os.path.abspath(os.getcwd()) + "\\tools\\visualizers\\Applications_Visualizer\\common") # Uncomment for debug in VSCode or running from Applications_Visualizer dir
    sys.path.insert(1, '../common')
    
    # PyQt Imports
    from PyQt5.QtCore import Qt
    from PyQt5.QtWidgets import QApplication
    
    # Window Class
    from gui_core import Window
    
    # Demo List
    from demo_defines import *
    
    # Logging (possible levels: DEBUG, INFO, WARNING, ERROR, CRITICAL)
    import logging
    
    # Uncomment this line for logging with timestamps
    # logging.basicConfig(format='%(asctime)s,%(msecs)03d %(levelname)-8s [%(filename)s:%(lineno)d] %(message)s', datefmt='%Y-%m-%d:%H:%M:%S', level=logging.INFO)
    
    logging.basicConfig(format='%(levelname)-8s [%(filename)s:%(lineno)d] %(message)s', level=logging.INFO)
    log = logging.getLogger(__name__)
    
    if __name__ == '__main__':
            for key in DEVICE_DEMO_DICT.keys():
                    DEVICE_DEMO_DICT[key]["demos"] = [x for x in DEVICE_DEMO_DICT[key]["demos"] if x in BUSINESS_DEMOS["Industrial"]]
    
            QApplication.setAttribute(Qt.HighDpiScaleFactorRoundingPolicy.PassThrough)
            app = QApplication(sys.argv)
            screen = app.primaryScreen()
            size = screen.size()
            main = Window(size=size, title="Industrial Visualizer")
            main.show()
            sys.exit(app.exec_())
    

    如何使用此代码从端口获取数据?

  • 请注意,本文内容源自机器翻译,可能存在语法或其它翻译错误,仅供参考。如需获取准确内容,请参阅链接中的英语原文或自行翻译。

    您好!

    如果您进行升级、则有一个包含更多源代码的"公共"文件夹。

    C:\ti\radar_toolbox_2_00_00_06\tools\visualizers\common Applications_Visualizer

    谢谢。

    克林顿

  • 请注意,本文内容源自机器翻译,可能存在语法或其它翻译错误,仅供参考。如需获取准确内容,请参阅链接中的英语原文或自行翻译。

    我一直收到反馈、称 AWRL6432BOOST 无法单独捕获原始数据。 我想再次确认事实并非如此吗?

  • 请注意,本文内容源自机器翻译,可能存在语法或其它翻译错误,仅供参考。如需获取准确内容,请参阅链接中的英语原文或自行翻译。

    您好!

    我曾认为您有兴趣了解更多有关发送到可视化工具的数据。 是的、您需要使用 DCA1000来执行原始数据采集。 我已直接链接到下面的用户指南和方法比较文档。

    https://dev.ti.com/tirex/content/radar_toolbox_2_00_00_06/docs/hardware_guides/dca1000_mmwave_studio_user_guide.html 

    https://dev.ti.com/tirex/content/radar_toolbox_2_00_00_06/docs/hardware_guides/raw_data_capture_tools_summary.html 

    谢谢。

    克林顿

  • 请注意,本文内容源自机器翻译,可能存在语法或其它翻译错误,仅供参考。如需获取准确内容,请参阅链接中的英语原文或自行翻译。

    "AWRL6432BOOST 是一款易于使用的低功耗60GHz 毫米波传感器评估套件、用于评估具有 FR4天线的 AWRL6432。 该板可访问点云数据并通过 USB 接口供电。

    AWRL6432BOOST 支持直接连接到 DCA1000EVM。 通过毫米波工具、演示和软件(包括毫米波软件开发套件(MMWAVE-L-SDK)和 Code Composer Studio 集成开发环境(IDE)(CCSTUDIO))、可为 BoosterPack 提供支持。

    可以使用附加板来启用其他功能。 例如、DCA1000EVM 支持传感器原始模数(ADC)数据采集。 板载 XDS110支持通过 CCStudio 进行软件开发。

    AWRL6432BOOST 可以与 MCU LaunchPad 开发套件生态系统相连接。"

    -这是否意味着我需要一个额外的板?

  • 请注意,本文内容源自机器翻译,可能存在语法或其它翻译错误,仅供参考。如需获取准确内容,请参阅链接中的英语原文或自行翻译。

    噢,我错过了这个地方

  • 请注意,本文内容源自机器翻译,可能存在语法或其它翻译错误,仅供参考。如需获取准确内容,请参阅链接中的英语原文或自行翻译。

    等等、但是否可以通过任何方法实时将要发送到可视化工具? 因为无论使用什么数据来绘制图形-该数据对我们来说已经足够好了

  • 请注意,本文内容源自机器翻译,可能存在语法或其它翻译错误,仅供参考。如需获取准确内容,请参阅链接中的英语原文或自行翻译。

    这些文件是否需要该附加板?

  • 请注意,本文内容源自机器翻译,可能存在语法或其它翻译错误,仅供参考。如需获取准确内容,请参阅链接中的英语原文或自行翻译。

    或者、运行此代码是否需要任何其他依赖项?