利用Graph画Single Time图
运行的算法是SPWM,5K的timer算法中断(PWM波频率)
程序里把360度电角度细分为512份存到一个数组里,利用查表得方式查角度,索引变量明是index
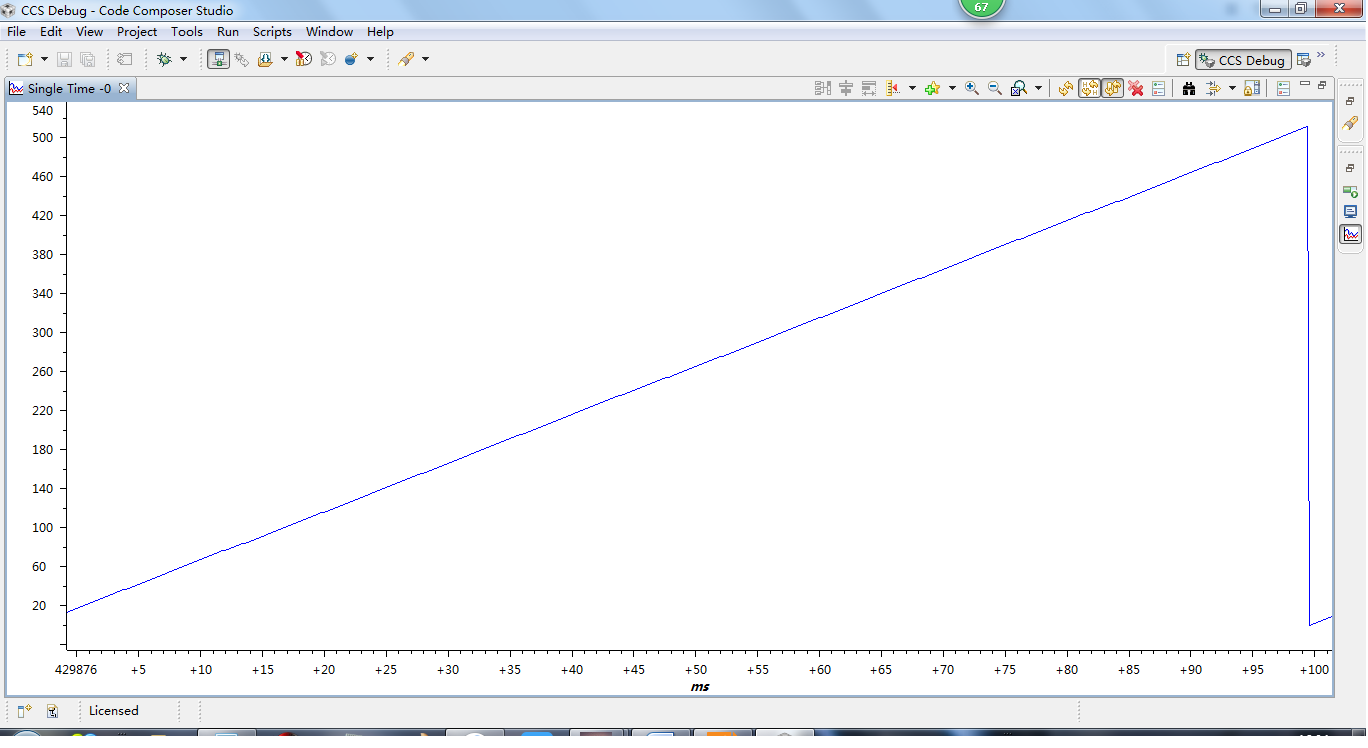
也就是如果用观测这个变量的波形应该是锯齿波,周期性从0到511.
我在代码里设置了一个512的数组,每200us进入算法中断王这个数组里存储一个index值。
Graph的设置如下:
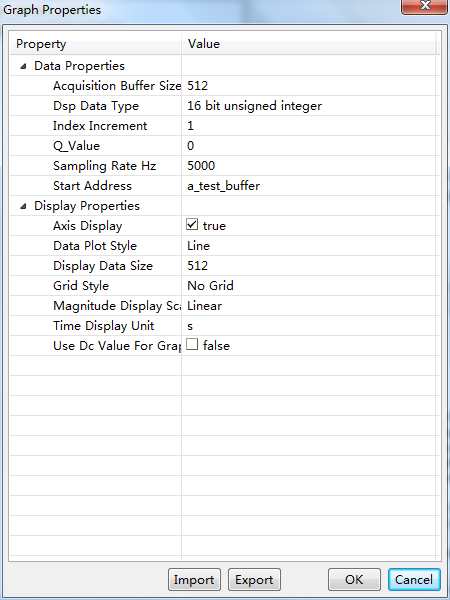
1.Acquisition Buffer Size 和 Display Data Size都设置为512
Acquisition Buffer 设置为512 是依据help里的“This is the size of the acquisition buffer you are using on your actual/simulated target board.”
代码里的设置的数组是512,所以这个buffer的大小也就设置为512了。
Display Data Size也设置为512,是依据“If your program processes an entire frame at one time (more than one sample) and you are only interested in that frame, enter the same value in the Acquisition Buffer Size and the Display Data Size fields. ”
但是help里的 Left-Shifted Data Display在哪里使能和关闭没有找到???
2.对于Sampling Rate (Hz)设置为5000,是依据“The axis is labeled from 0 to (Display Data Size * 1/Sampling Rate).” 我的代码里是每隔0.0002秒即200us存一个数据,数组大小是512,所以经过512*0.0002=0.1024秒数组存满,所以我把时间轴设置为0到512/5000(sample rate)=0.1024秒的范围
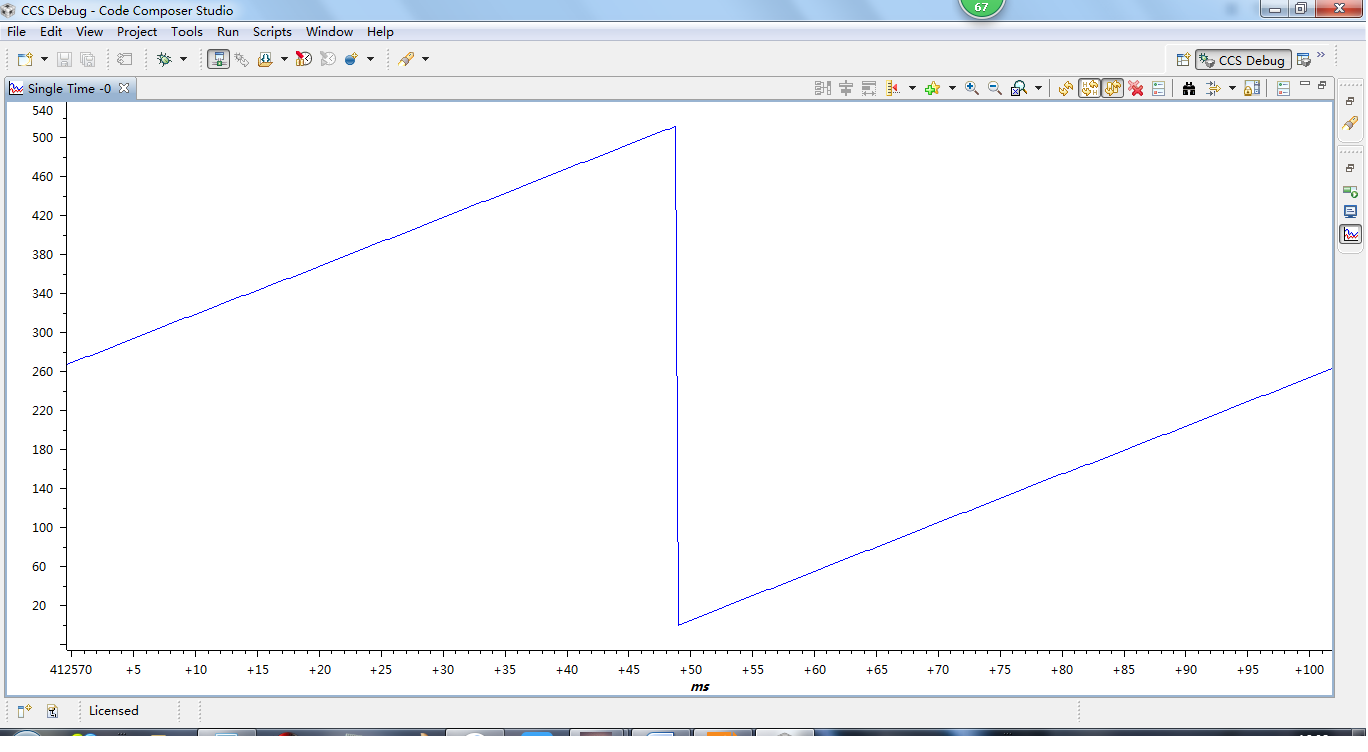
观测到的波形图如下:
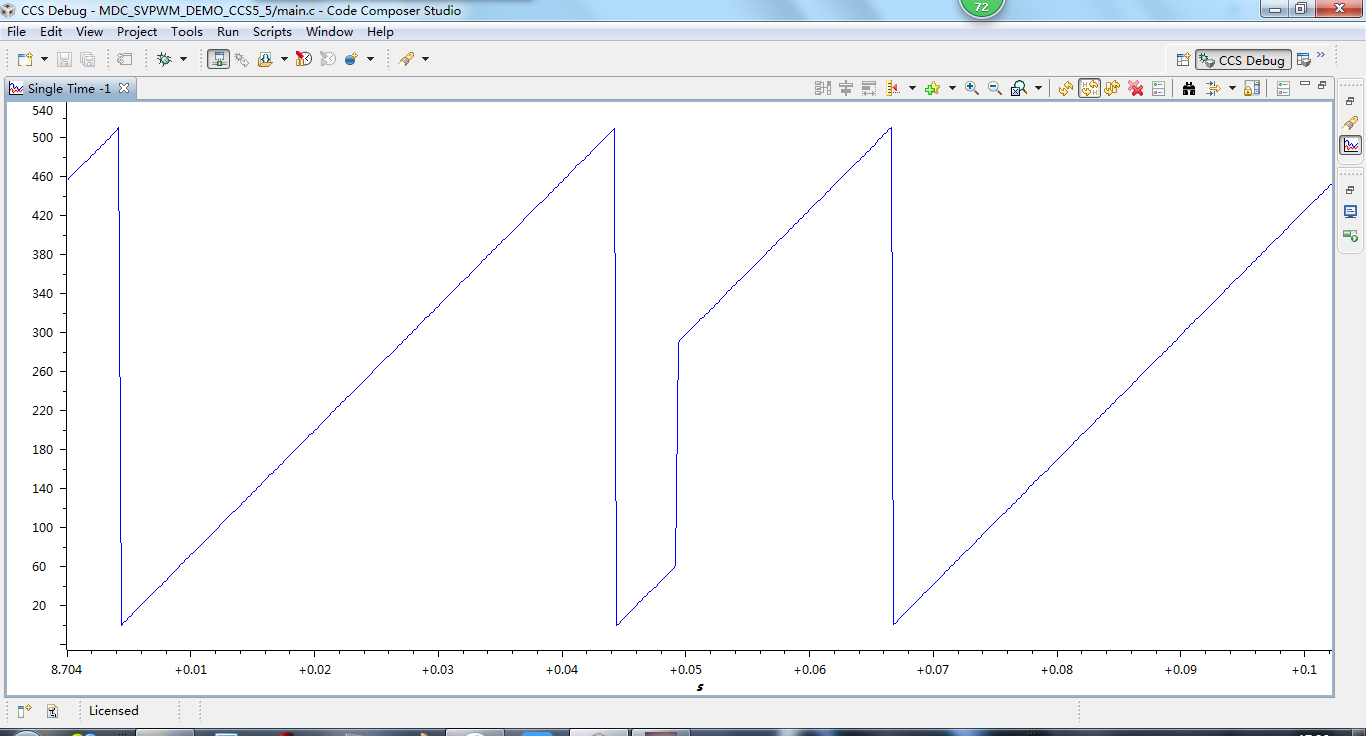
请问:
为什么会有不连续的部分呢?
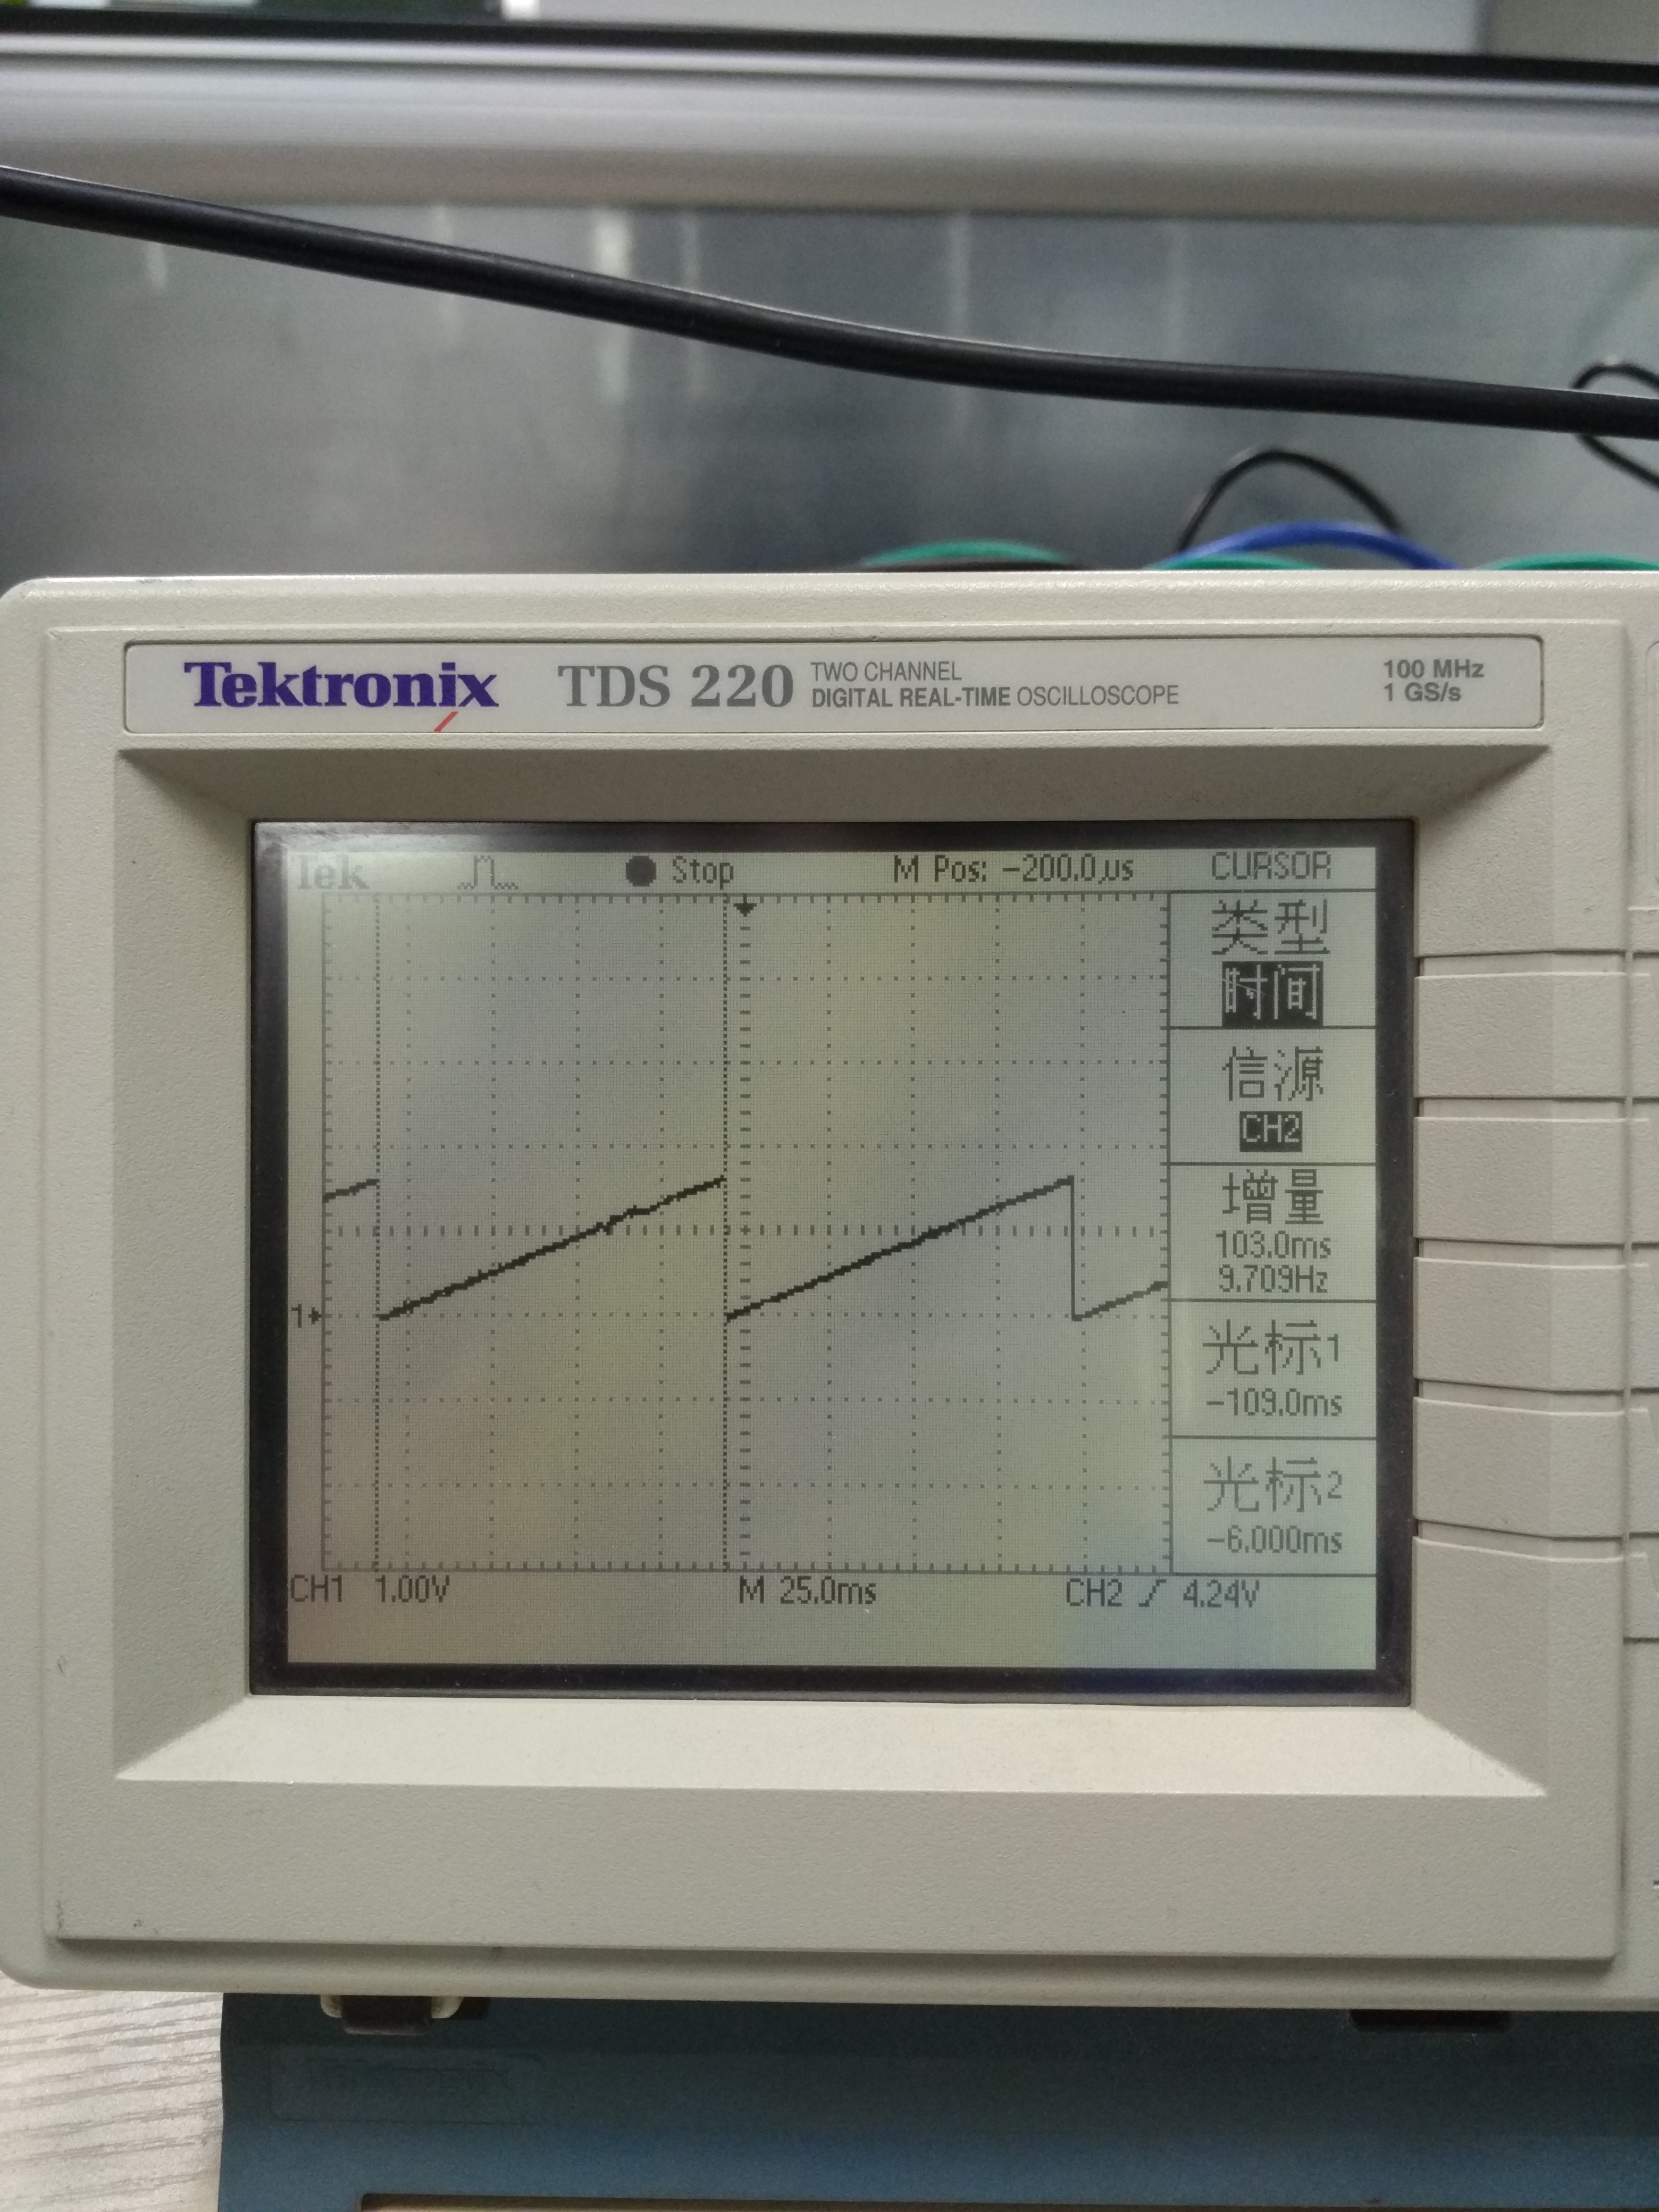
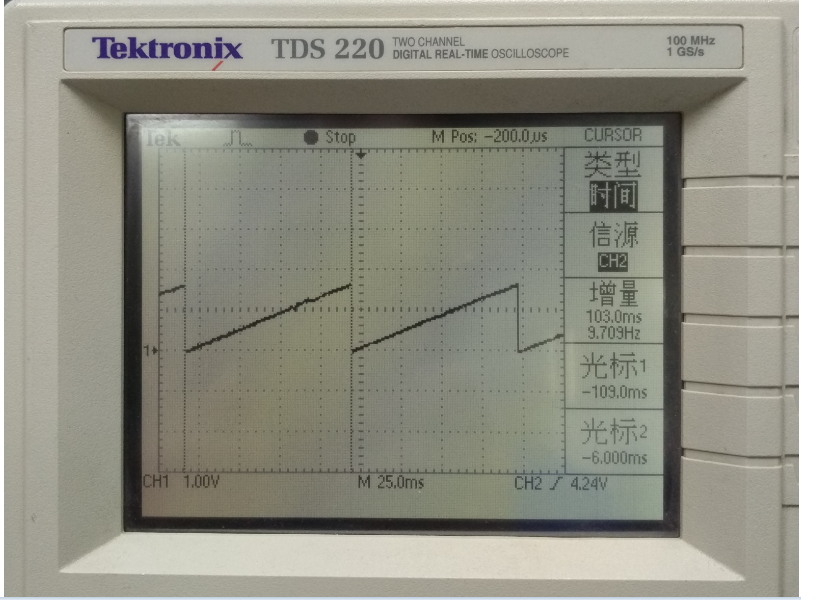
我验证了一个完整周期的正确性:
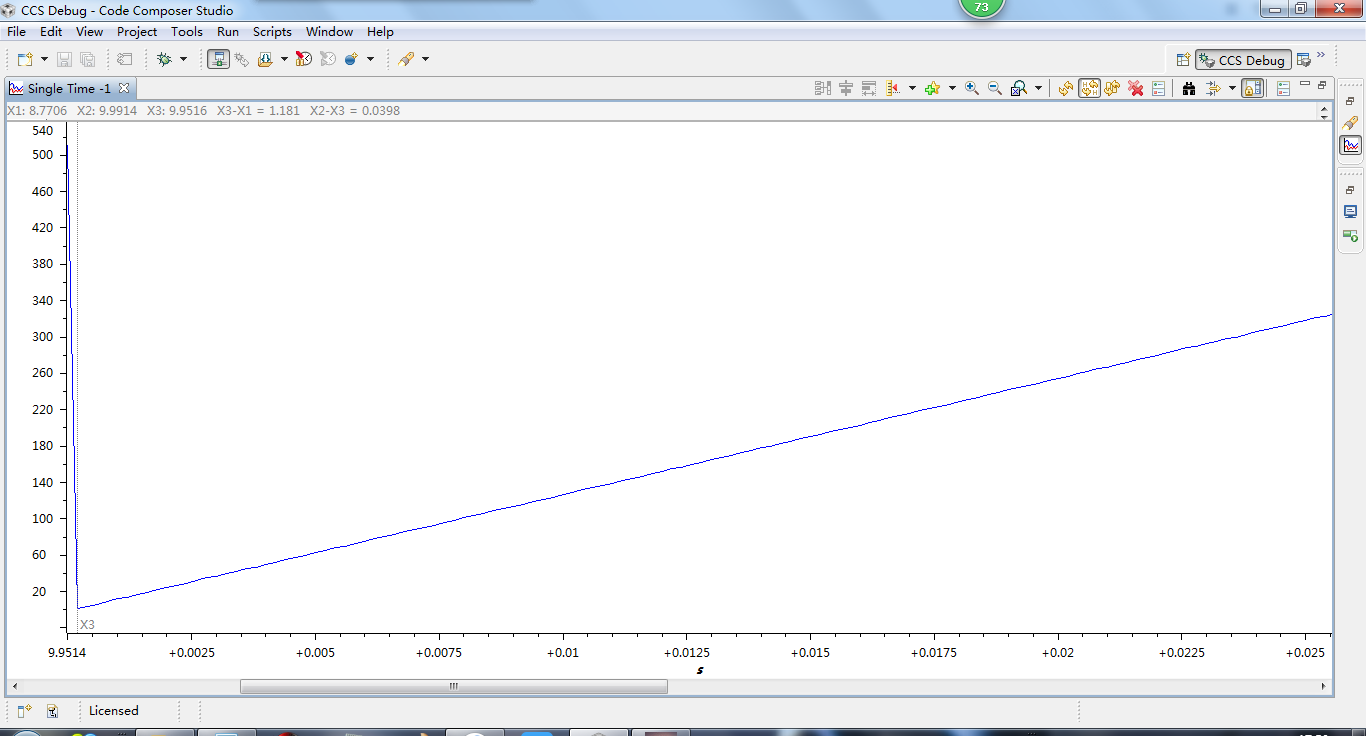
如上图,时间轴设置了另个节点,电角度转过360所用的时间为X2-X3=0.0398s
我的鼠笼机是2对极的
所以360度电角度对应180度机械角度,对应0.5rpm
极同步磁场的旋转速度为(0.5/0.0398)x 60 = 753.7rpm
我的转速设置为750rpm,由此可以看出,完整周期下的波形应该是正确的,大家看看不规则的波形是怎么造成的呢 谢谢!