

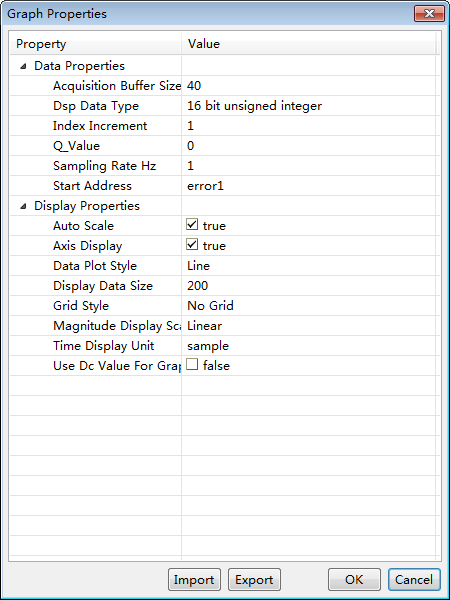
输入信号为50HZ,750mv——2.75v的正弦波,采样频率为2000HZ

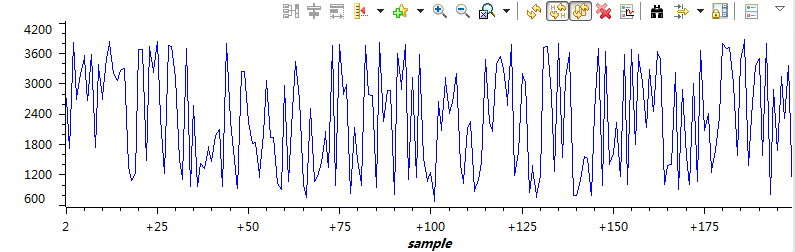
对单个变量进行图形显示,完全乱套

若用数组,由于2000/50=40,即一个周期为40个点,若数组设为50,波形也不正确
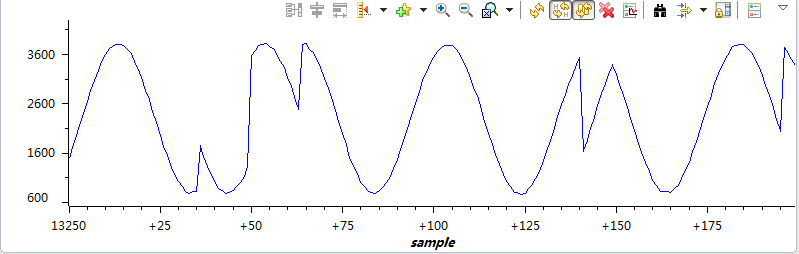

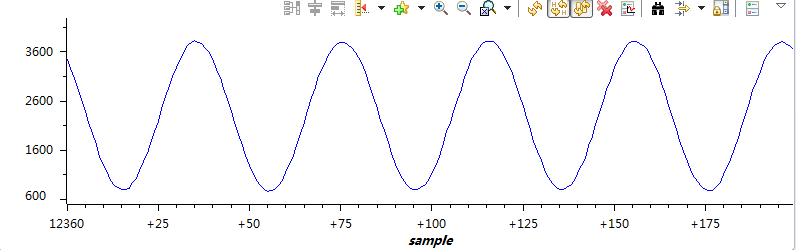
只有当数组长度为周期数的整数倍时波形才正确
我是不是哪里设置的有问题?!求大神解答,谢谢!
输入信号为50HZ,750mv——2.75v的正弦波,采样频率为2000HZ
对单个变量进行图形显示,完全乱套
若用数组,由于2000/50=40,即一个周期为40个点,若数组设为50,波形也不正确
只有当数组长度为周期数的整数倍时波形才正确
我是不是哪里设置的有问题?!求大神解答,谢谢!
