This thread has been locked.
If you have a related question, please click the "Ask a related question" button in the top right corner. The newly created question will be automatically linked to this question.
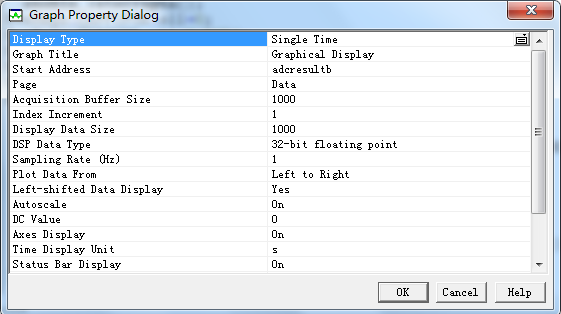
我的graph设置是这样的
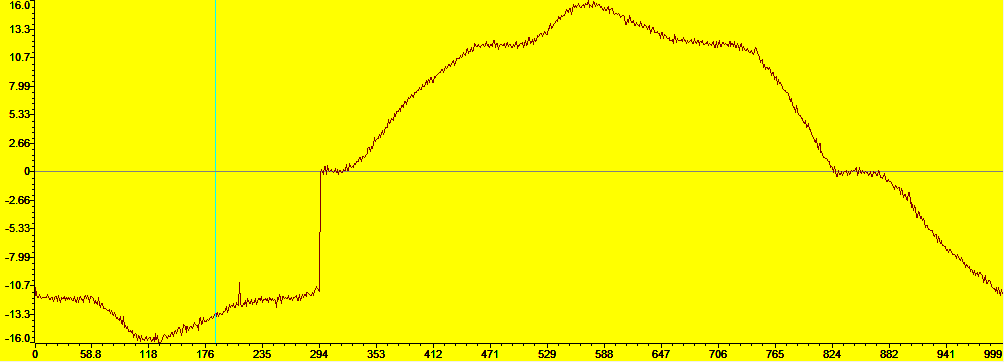
我是设置一个数组,在每个AD中断读取一个采样信号,然后读取1000个数据后清零
已找到答案,谢谢,我在之前的问题里发现答案了
http://www.deyisupport.com/question_answer/microcontrollers/c2000/f/56/t/109071.aspx
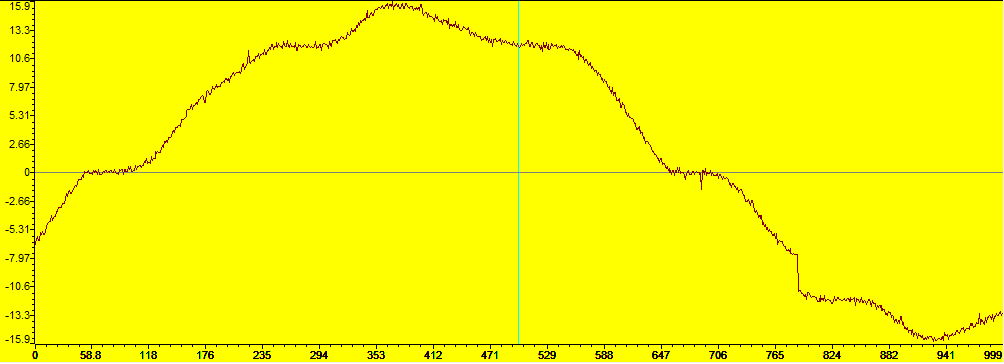
我把存储数据的数组个数改为每个周期采样点的整数倍后,整个效果好多了