

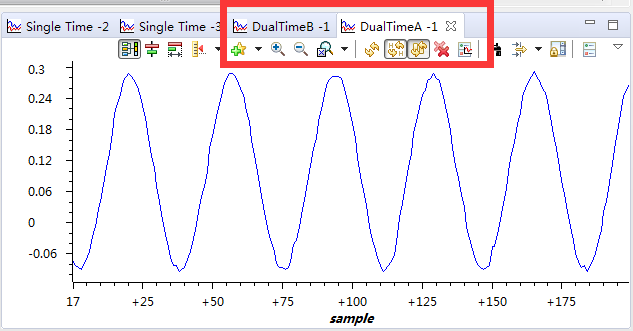
使用ADC采集两路数据,准备将两个波形显示在一张图上,好方便分析比较。
选取dual time graph ,设置后两个波形显示在了两张图上,和single time一样。
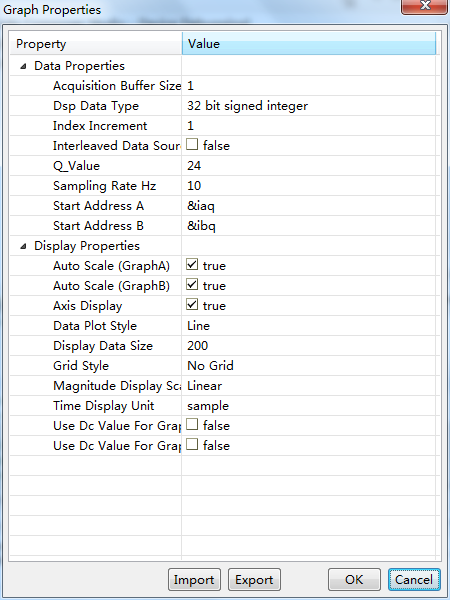
如何设置显示在一张图上呢,下面是我的截图,谢谢。
CCS版本是8.0 ,使用7.4时也遇到了这样的问题。系统WIN7
使用ADC采集两路数据,准备将两个波形显示在一张图上,好方便分析比较。
选取dual time graph ,设置后两个波形显示在了两张图上,和single time一样。
如何设置显示在一张图上呢,下面是我的截图,谢谢。
CCS版本是8.0 ,使用7.4时也遇到了这样的问题。系统WIN7
