If you have a related question, please click the "Ask a related question" button in the top right corner. The newly created question will be automatically linked to this question.
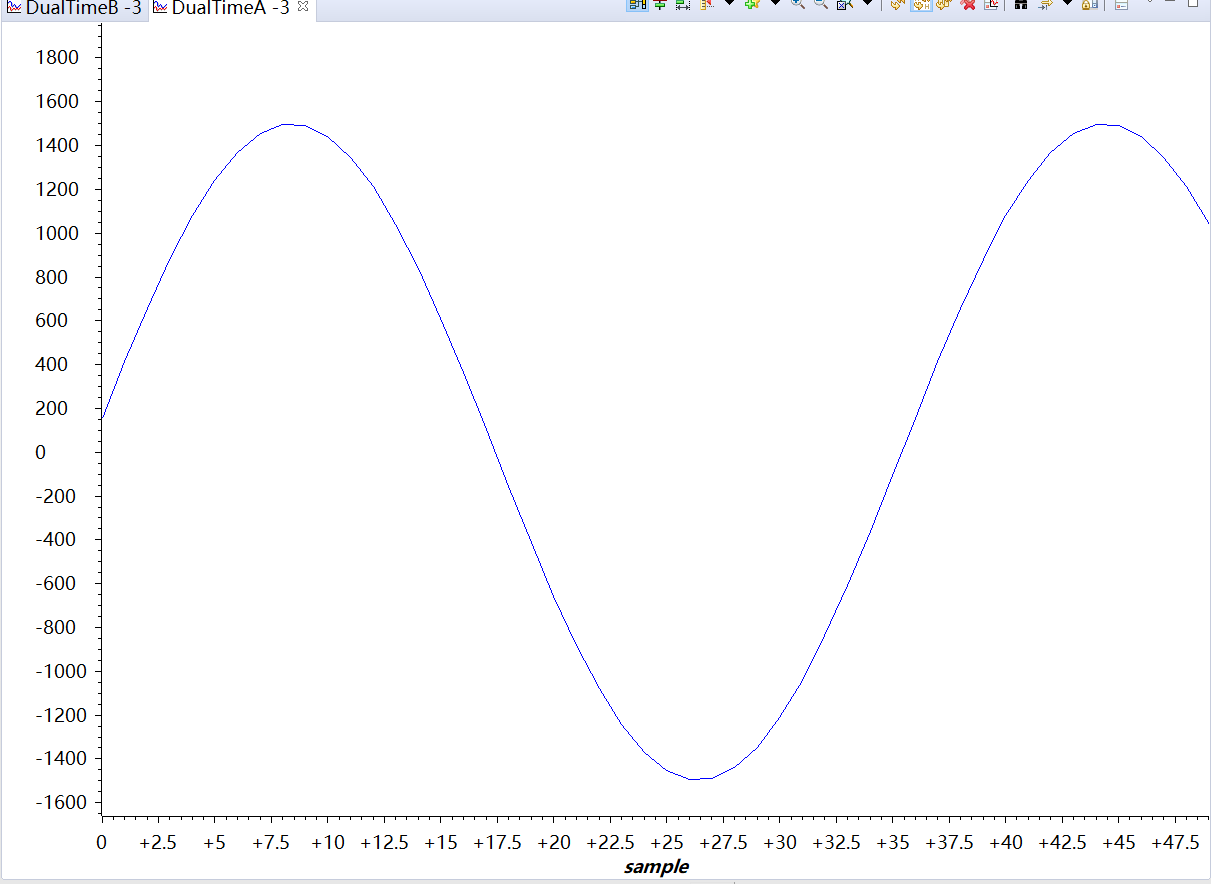
This graph plots the data in the display buffer on a magnitude versus time graph with no preprocessing. A dual time trace of signal(s) is displayed on the graph, allowing you to plot two time domain traces in a single graph window.