This thread has been locked.
If you have a related question, please click the "Ask a related question" button in the top right corner. The newly created question will be automatically linked to this question.
您好
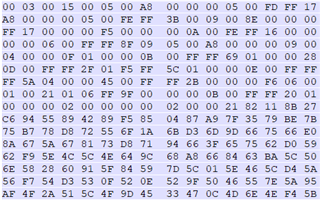
我將demo visualizer中存取的數據打開
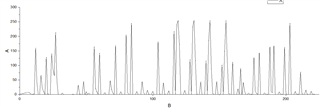
並轉成10進位再作圖如下
請問這份demo visualizer存取的數據是代表range profile嗎?
或是是代表其他意思?
謝謝
这个data file格式,请参考packages\ti\demo\xwr16xx\mmw\docs\doxygen\html\index.html里的Output information sent to host章节。