This thread has been locked.
If you have a related question, please click the "Ask a related question" button in the top right corner. The newly created question will be automatically linked to this question.
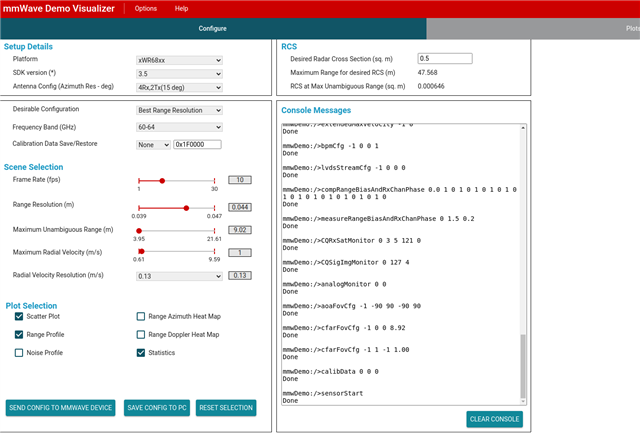
在使用windows系统下的mmWave Demo Visualizer软件可以得到可视化的数据
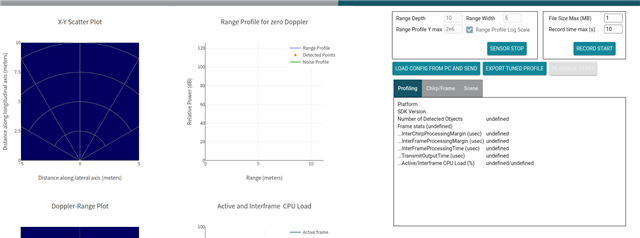
但在ubuntu18.04下使用网页版的mmWave Demo Visualizer,一切正常但在Plots看不到可视化结果,发现在Plots下的Profiling得到的数据都是undefined,如图
其他都是正常的:
1. 数据格式不正确:请确保从IWR6843传输到Ubuntu的数据格式正确。如果数据格式不正确,可能会导致无法正确地显示可视化结果。您可以检查数据格式是否正确,并尝试重新传输数据。
2. 网页浏览器不兼容:请确保您使用的网页浏览器与mmWave Demo Visualizer兼容。如果网页浏览器不兼容,可能会导致无法正确地显示可视化结果。您可以尝试更换网页浏览器,并重新打开mmWave Demo Visualizer。
后面我下载了ubuntu下的app来可视化也不行,请问怎么看数据格式是否正确呢
我用了github的一些脚本发现得到的数据格式找不到magicWord = [2, 1, 4, 3, 6, 5, 8, 7],即类似标识符,请问如何矫正我得到的雷达数据呢,真的很需要帮忙谢谢
在Ubuntu下,您可以使用命令行工具如cat、head、tail等来查看文件的内容。
你还可以尝试使用一些在线的数据可视化工具来导入数据并进行可视化,比如Tableau、Google Data Studio
我可以看见数据格式了,请问如何矫正呢
您好,
个人为您推荐另一种方法
1. 确保您的Ubuntu系统上已安装Chrome浏览器
2. 确保您已正确安装了mmWave Demo Visualizer,并且已按照说明进行了配置。
3. 确保您的系统上已安装了必要的图形库和依赖项,例如OpenGL和GTK。您可以通过运行以下命令来安装它们:
sudo apt-get install libgl1-mesa-dev
sudo apt-get install libgtk-3-dev
4. 确保您的浏览器已启用了WebGL。您可以在浏览器地址栏中输入
chrome://flags
5. 确保您的浏览器已启用了JavaScript。
您可以在Chrome浏览器中按F12打开控制台获取更多信息