This thread has been locked.
If you have a related question, please click the "Ask a related question" button in the top right corner. The newly created question will be automatically linked to this question.
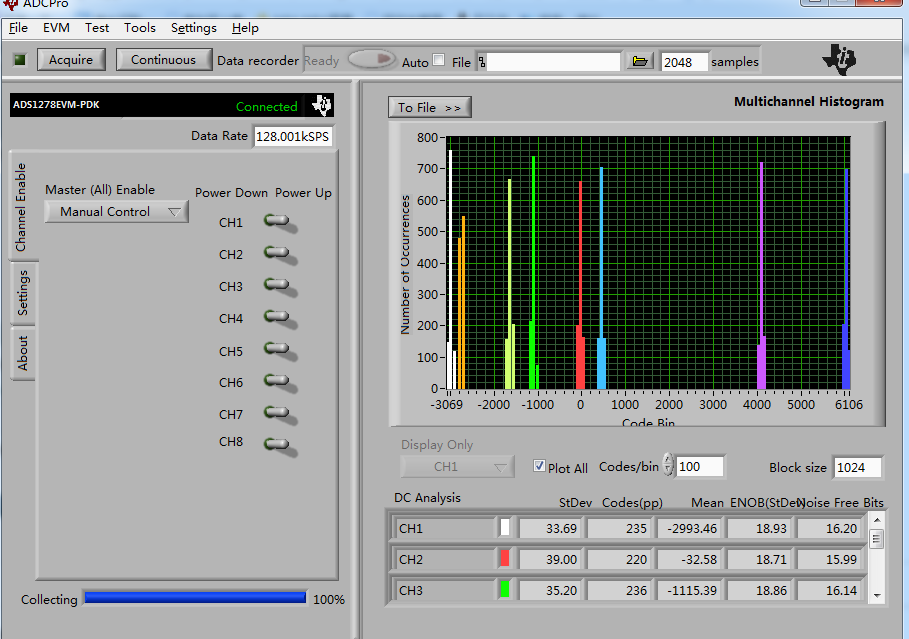
尊敬的TI工程师,你们好,请问下图测出来的结果是正确的吗?图中的柱状图代表什么?表中ENOB一栏的的值是利用那一栏的值计算出来的,怎么算?谢谢
您好,
您现在使用的直方图, x轴是采样得到的数值,y轴是采样到这个数值的数量.
ENOB的意义和计算方法:http://e2e.ti.com/support/data_converters/precision_data_converters/w/design_notes/2763.input-referred-noise-vs-enob?keyMatch=ENOB&tisearch=Search-EN-Everything
Kevin
首先,感谢您的耐心解答。我还有以下几个问题想请教您
1、帖子中贴出的这个图,是在没有外接输入的情况下得到的,那么图中的结果针对的输入时什么
2、ads1278手册中给出的SNR最大为111db,用这个数据计算出来的ENOB值为18.15,我图中的ENOB最大值能达到19.75,这是对的吗
3、我用ads1278搭建了一个采集系统,有没有什么办法测试我这个采集系统输出数据的ENOB
希望得到您的解答,再次表示感谢
Kevin Wen 说: 您好, 您现在使用的直方图, x轴是采样得到的数值,y轴是采样到这个数值的数量. ENOB的意义和计算方法:http://e2e.ti.com/support/data_converters/precision_data_converters/w/design_notes/2763.input-referred-noise-vs-enob?keyMatch=ENOB&tisearch=Search-EN-Everything Kevin