请注意,本文内容源自机器翻译,可能存在语法或其它翻译错误,仅供参考。如需获取准确内容,请参阅链接中的英语原文或自行翻译。
器件型号:TMS320F28379D 工具/软件:Code Composer Studio
您好!
我的程序正在获取 ILLEGAL_ISR。
当我尝试使用单步执行重新生成它时、行为不会重新生成-尽管一旦我执行无单步执行的运行、就会发生这种情况。
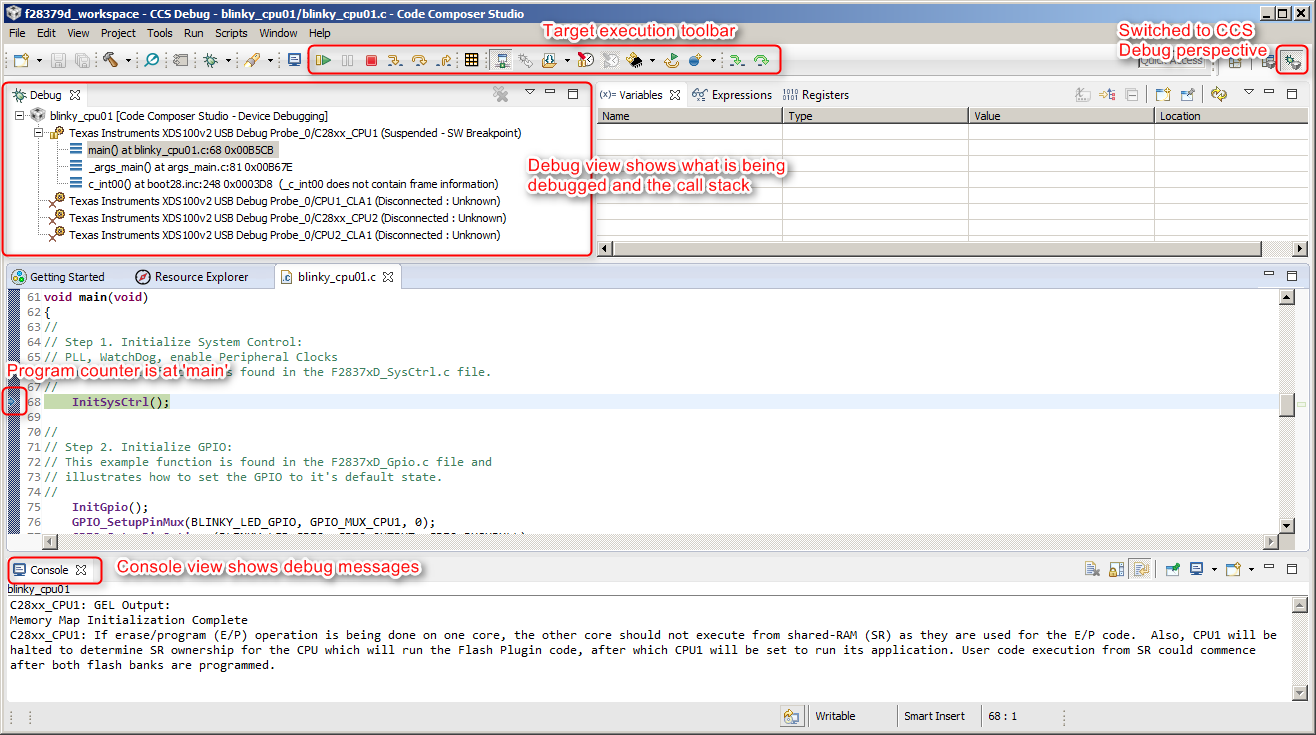
我需要查看函数调用栈/函数调用跟踪、以查看触发 ILLEGAL_ISR 的是什么。
如何/在 Code Composer Studio 中的什么位置看到它? 是否可以将我路由到文档/链接?
谢谢、致以诚挚的问候
Bhwandeep Singh