Other Parts Discussed in Thread: SK-AM62, SK-AM62-LP, SK-AM62B-P1
请注意,本文内容源自机器翻译,可能存在语法或其它翻译错误,仅供参考。如需获取准确内容,请参阅链接中的英语原文或自行翻译。
器件型号:AM625 主题中讨论的其他器件: SK-AM62-LP、 SK-AM62B-P1、SK-AM62
您好!
这是几个月前发布的之前主题帖和讨论的后续内容:
软件/硬件配置:
- TI SDK 09.02.01.09
-定制硬件(各种配置的存储器大小和存储器供应商,不同的 SOC 变体: AM6254、AM6231、AM6252)
-内核来源: https://git.toradex.com/cgit/linux-toradex.git/log/?h=toradex_ti-linux-6.1.y
- U-Boot 源代码: https://git.toradex.com/cgit/u-boot-toradex.git/log/?h=toradex_ti-u-boot-2023.04
- DDR 由我们内部验证, 并由存储器供应商在其办公场所进行验证。 我们有不同尺寸和供应商的存储器型号、它们都受到相同问题的影响
-我们有0.75V 和0.85V VDD_CORE 的变体,没有因为这种行为的差异
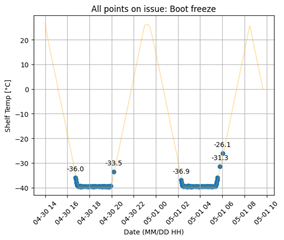
在对我们的软件/硬件进行测试期间、我们面临一些不同方式的启动停止问题。 它们都在 -20摄氏度以下发生。
1.系统因以下错误而停止。
[   86.779029] rcu: INFO: rcu_preempt detected stalls on CPUs/tasks:
[   86.785173] rcu: 	Tasks blocked on level-0 rcu_node (CPUs 0-0): P186/1:b..l
[   86.792151] 	(detected by 0, t=18276 jiffies, g=6889, q=115 ncpus=1)
[   86.798506] task:systemd-udevd   state:R  running task     stack:0     pid:186   ppid:173    flags:0x00000a04
[   86.808424] Call trace:
[   86.810870]  __switch_to+0xd4/0x130
[   86.814374]  __schedule+0x230/0x664
[   86.817863]  preempt_schedule_irq+0x44/0xd0
[   86.822047]  el1_interrupt+0x4c/0x70
[   86.825626]  el1h_64_irq_handler+0x18/0x2c
[   86.829725]  el1h_64_irq+0x64/0x68
[   86.833130]  set_root+0x64/0xfc
[   86.836275]  nd_jump_root+0xb8/0xf0
[   86.839764]  path_init+0x2d0/0x380
[   86.843167]  path_parentat+0x20/0xb0
[   86.846743]  __filename_parentat+0xa4/0x1c0
[   86.850927]  do_unlinkat+0x68/0x270
[   86.854416]  __arm64_sys_unlinkat+0x40/0x84
[   86.858600]  invoke_syscall+0x48/0x114
[   86.862352]  el0_svc_common.constprop.0+0xd4/0xfc
[   86.867057]  do_el0_svc+0x20/0x30
[   86.870372]  el0_svc+0x28/0xa0
[   86.873428]  el0t_64_sync_handler+0xbc/0x140
[   86.877701]  el0t_64_sync+0x18c/0x190
[   86.881364] rcu: rcu_preempt kthread timer wakeup didn't happen for 18273 jiffies! g6889 f0x0 RCU_GP_WAIT_FQS(5) ->state=0x402
[   86.892749] rcu: 	Possible timer handling issue on cpu=0 timer-softirq=2071
[   86.899705] rcu: rcu_preempt kthread starved for 18274 jiffies! g6889 f0x0 RCU_GP_WAIT_FQS(5) ->state=0x402 ->cpu=0
[   86.910136] rcu: 	Unless rcu_preempt kthread gets sufficient CPU time, OOM is now expected behavior.
[   86.919260] rcu: RCU grace-period kthread stack dump:
[   86.924305] task:rcu_preempt     state:I stack:0     pid:14    ppid:2      flags:0x00000008
[   86.932656] Call trace:
[   86.935099]  __switch_to+0xd4/0x130
[   86.938587]  __schedule+0x230/0x664
[   86.942074]  schedule+0x5c/0xcc
[   86.945216]  schedule_timeout+0x84/0xfc
[   86.949055]  rcu_gp_fqs_loop+0x12c/0x46c
[   86.952983]  rcu_gp_kthread+0x128/0x164
[   86.956820]  kthread+0x10c/0x110
[   86.960051]  ret_from_fork+0x10/0x20
[   86.963627] rcu: Stack dump where RCU GP kthread last ran:
[   86.969111] CPU: 0 PID: 181 Comm: systemd-udevd Not tainted 6.1.80+git.0d9f1748ac17 #1
[   86.977026] Hardware name: Toradex Verdin AM62 WB on Verdin Development Board (DT)
[   86.984591] pstate: 60000005 (nZCv daif -PAN -UAO -TCO -DIT -SSBS BTYPE=--)
[   86.991550] pc : iomap_read_reg+0x10/0x30 [m_can_platform]
[   86.997049] lr : m_can_get_berr_counter+0x3c/0x10c [m_can]
[   87.002548] sp : ffff8000099735f0
[   87.005858] x29: ffff8000099735f0 x28: 0000000000000240 x27: ffff800000cca1a0
[   87.012998] x26: ffff000003f9e000 x25: ffff000003f9e240 x24: 0000000000000000
[   87.020137] x23: 0000000000000000 x22: ffff0000002ae410 x21: ffff0000035f8000
[   87.027276] x20: ffff0000035f8980 x19: ffff80000997362c x18: 0000000000000000
[   87.034414] x17: ffff800014add000 x16: ffff800008000000 x15: 0000000000000000
[   87.041552] x14: 000000000000022f x13: 0000000000000001 x12: 0000000000000001
[   87.048691] x11: 0000000000000000 x10: 00000000000009b0 x9 : ffff8000099731e0
[   87.055829] x8 : ffff00001da1b180 x7 : 0000010000108100 x6 : ffff0000002ae590
[   87.062968] x5 : 0000000000000000 x4 : 0000000000000000 x3 : 0000000000000000
[   87.070106] x2 : ffff800000ca4000 x1 : 0000000000000040 x0 : 000000000071ff00
[   87.077244] Call trace:
[   87.079687]  iomap_read_reg+0x10/0x30 [m_can_platform]
[   87.084832]  can_fill_info+0x108/0x524 [can_dev]
[   87.089477]  rtnl_fill_ifinfo+0x844/0x11b0
[   87.093578]  rtnl_getlink+0x23c/0x424
[   87.097239]  rtnetlink_rcv_msg+0x130/0x3a0
[   87.101334]  netlink_rcv_skb+0x60/0x130
[   87.105174]  rtnetlink_rcv+0x18/0x2c
[   87.108755]  netlink_unicast+0x2f0/0x360
[   87.112677]  netlink_sendmsg+0x1b0/0x420
[   87.116600]  __sys_sendto+0x138/0x174
[   87.120265]  __arm64_sys_sendto+0x28/0x3c
[   87.124275]  invoke_syscall+0x48/0x114
[   87.128024]  el0_svc_common.constprop.0+0xd4/0xfc
[   87.132729]  do_el0_svc+0x20/0x30
[   87.136044]  el0_svc+0x28/0xa0
[   87.139100]  el0t_64_sync_handler+0xbc/0x140
[   87.143372]  el0t_64_sync+0x18c/0x190
完整日志:
e2e.ti.com/.../24_2D00_04_2D00_17_5F00_22_2D00_12_2D00_36_2D00_Fail.txt
2.没有任何消息的引导停止。
不过、根据我可以告诉您的、没有有关正在发生什么的提示、请参阅所附的日志
e2e.ti.com/.../24_2D00_04_2D00_17_5F00_18_2D00_29_2D00_29_2D00_Fail.txt