This thread has been locked.
If you have a related question, please click the "Ask a related question" button in the top right corner. The newly created question will be automatically linked to this question.
https://e2e.ti.com/support/processors-group/processors/f/processors-forum/1390617/am6422-linux-icssg0-mii
工具与软件:
您好、
我们目前正在使用自己的硬件来制造 ICSSG0的 MII 接口以太网。 PHY 芯片为 DP83620。 我认为 PHY 驱动程序目前不需要特殊处理。 我们使用 emac0作为网络端口。 应如何修改相应的设备树? 您能举个例子吗? 谢谢您!
您好!
哪个处理器内核负责控制 PRU 以太网? 该处理器内核上运行的是什么操作系统?
此致、
Nick
等一下、我看到你指定了 Linux 来控制该接口。 如果您正在运行哪个版本的 SDK、那也会很有帮助。
首先、您可以参阅此处的 Foundational_Components SDK 文档:https://software-dl.ti.com/processor-sdk-linux/esd/AM64X/09_02_01_09/exports/docs/linux/SDK/PRU-ICSS/Linux Linux_Drivers PRU_ICSSG_Ethernet.html
具体来说、您可以在此处找到有关选择 devicetree 文件的 MII 版本的信息: https://software-dl.ti.com/processor-sdk-linux/esd/AM64X/09_02_01_09/exports/docs/linux/Foundational_Components / PRU-ICSS / Linux_Drivers / PRU_ICSSG_ETHERNET.html#MII-support
有关在 Linux devicetre 文件中设置 MII 接口的指导、请参阅 devicetree 文件的 Dualemac-MII 版本。
我使用的版本是8.06。目前、我们的硬件上有三个网络端口、即 ICSSG0的两个 CPSW 和一个 MII 接口 emac0。 在这种情况下、应如何修改器件树? 原始设备树文件仅定义了两个以太网。 如果我使用三个以太网、我应该直接将什么添加到设备树中? 您能举个例子吗? 非常感谢!
现有的 AM64x Linux devicetree 文件是否不足以为您提供示例? AM64x EVM 有3个端口、您可以将其设置为2 CPSW 和1 ICSSG、或者1 CPSW 和2 ICSSG。
这些文件位于 arch/arm64/boot/dts/ti/k3-am64*
在初始化过程的前面、您看到什么类型的终端输出? 我想查看 Linux 驱动程序初始化 PRU 内核、PHY 等时的输出、以便查看是否有任何错误、警告或其他有用信息。
我先介绍我的硬件。 以太网部分需要 CPSW 的1和2端口, icssg0 emac1,不使用 emac2。 PHY 型号为 DP83620、接口模式为 mii。我之前遇到 CPSW eth0可以识别连接但 ping 失败的情况。 通过在 uboot 路径下的器件树文件中添加两个 CPSW 端口、两个端口都可以正常工作。 但此时,icssg0的网络端口不再被识别。我不知道为什么? 我可以通过在内核中修改设备树使其正常工作、为什么需要在 uboot 中更改设备树文件?
当我将内核中相同的 icssg0相关器件添加到 uboot 中的设备树文件中时、会报告一个错误、like icssg0_eth can not found 。icssg0_emac0 can not found、icssg0_mdio can not found、
我发现一个问题。 在上一次回复中、uboot 中的器件树文件被修改、导致无法识别 ICSSG。 我直接更新了默认映像、并将内核配置的 ICSSG 器件树后编译的 DTB 文件覆盖到 SD 卡中。 现在可以识别 eth2以太网、但 ping 不可用。 以下是我的启动信息、相应的操作信息也如下所示。 请帮助分析它。 感谢您!e2e.ti.com/.../ICSSG_536270538476_timeout_886D6F60_.c
我在文档中看到过这一部分。 需要在 uboot 命令行下输入此部件。 输入后是否有任何可以打印出来的信息? 关于 k3-am642-evm-icssg1-dualemac-MII.dtbo 文件、如果我们使用 ICSSG0、则此文件应在何处? 能否更详细地解释一下?
是否有进展? 我们的项目正在等待问题的解决。
很抱歉这里的答复被推迟。 我今天要尝试深入到你的主题中、但它已经上床了、我必须签核。 我会在第二天左右尝试给你一个回应。
是否有进展?
仍然没有新闻? 我们渴望快速找到问题!
您好、Wanglili、
对于持续的延误、我深表歉意。 这是另一个睡前的反应,所以还没有更新:(
此外、使用以太网命令可以发现发送的数据为0。
ethtool -S eth2 NIC 统计信息: RX_GOOD_FRAMES:208 RX_BROADCAST_FRAMES:38 RX_MULTICAST_FRAMES:208 RX_CRC_ERROR_FRAMES:0 RX_MII_ERROR_FRAMES:0 RX_ODD_NIBABLE_FRAMES:0 RX_FRAME_MAX_SIZE:10000 RX_max_size_error_FRAMES:0 RX_FRAME_MIN_SIZE:320 RX_MIN_SIZE_ERROR_FRAMES:0 RX_OVERRUNRY_FRAMES:0 rx_class0_hits:208. RX_CLASS1_Hits:0 RX_CLASS2_Hits:0 RX_CLASS3_Hits:0 RX_CLASS4_Hits:0 RX_CLASS5_Hits:0 RX_CLASS6_Hits:0 RX_CLASS7_Hits:0 rx_class8_hits:208. rx_class9_hits:208. RX_CLASS10_Hits:0 RX_class11_hits:0 RX_class12_hits:0 RX_CLASS13_Hits:0 RX_class14_hits:0 RX_CLASS15_Hits:0 RX_SMD_FRags:0 RX_BUCKET1_SIZE:320 RX_BUCKET2_SIZE:640 RX_BUCKET3_SIZE:1280 Rx_Bucket4_SIZE:2560 RX_64B_帧:35 RX_BUCKET1_FRAMES:35. RX_BUCKET 2_FRAMES:75 RX_BUCKET 3_FRAMES:51. RX_BUCKET 4_FRAMES:0 RX_BUCKET 5_FRAMES:47. RX_TOTAL_BYTES:56321 RX_TX_TOTAL_BYTES:56321 TX_GOOD_FRAMES:0 TX_BROADCAST_FRAMES:0 TX_MULTICAST_FRAMES:0 tx_odd_nibble_FRAMES:0 TX_UNDERFLOW_ERRORS:0 TX_FRAME_MAX_SIZE:10000 tx_max_size_error_FRAMES:0 TX_FRAME_MIN_SIZE:320 TX_MIN_SIZE_ERROR_FRAMES:0 tx_bucket1_size:320 tx_bucket2_size:640 tx_bucket3_size:1280 tx_bucket4_size:2560 TX_64B_FRAMES:0 TX_BUCKET1_FRAMES:0 TX_BUCKET2_FRAMES:0 TX_BUCKET3_FRAMES:0 TX_BUCKET4_FRAMES:0 TX_BUCKET5_FRAMES:0 tx_total_bytes:0
是否有新的想法?
有更新吗? 在论坛上没有解决这个问题的办法。 您能否提供有关使用 ICSSG0以太网 MII 接口的完整操作指南? 我们非常紧迫。
对于这里的答复延迟、我们深表歉意。 知道您正在寻找短期解决方案。
Linux 内核6.1版本上的 MII 操作存在一些问题(在另一个主题中讨论: https://e2e.ti.com/support/processors-group/processors/f/processors-forum/1314903/am6442-icssg0-mii-doesn-t-work-in-sdk9-1-0-8 )。
只是为了确认、您是否仍在使用 SDK 8.6? (即 Linux 内核5.10)
是的、我们仍计划使用8.6版。
uboot 中的 AM64x PRU 以太网?
我们在 AM64x SDK 8.6上的 u-boot 中不支持 PRU 以太网。 我们从 SDK 9.2.1开始在 u-boot 中添加了对 AM64x PRU 以太网的支持、如以下常见问题解答中所述: https://e2e.ti.com/support/processors-group/processors/f/processors-forum/1325243/faq-am6548-how-to-get-pru-ethernet-working-in-u-boot-on-am65x-linux-sdk-9-1
因此、我预计将 PRU 以太网节点添加到 uboot devicetre 文件不会有任何效果。
有关查看引导日志的其他注意事项-优化 DDR 使用
[    7.155776] platform 78000000.r5f: configured R5F for remoteproc mode
[    7.155899] k3_r5_rproc bus@f4000:r5fss@78000000: split-mode not permitted, force configuring for single-cpu mode
AM6422有两个 R5F 子系统、其中每个子系统只有一个 R5F 内核(而 AM644x 中每个子系统有2个 R5F 内核)。 此 终端输出确认每个子系统只有一个 R5F 内核、因为 R5F 驱动器将该子系统设置为单 CPU 模式。
这意味着、您可以释放 devicetree 文件中为 AM6422上不存在的 R5F 内核分配的 DDR 存储器区域。 请参阅 AM64x Academy 多核模块页面"如何禁用远程内核": https://dev.ti.com/tirex/explore/node?a=7qm9DIS__LATEST&node=A__Af8fKrelrD3vCdWjTx7.ww__AM64-ACADEMY__WI1KRXP__LATEST
如果您有关于禁用未使用的远程内核的后续问题、请随时创建新主题进行讨论。
我很快会提供另一个响应。
那么 MII 接口呢?
您能够建立链路、因此 PHY 能够与另一个 PHY 自动协商。
并且您的接收路径看起来正常、因为您可以接收数据包、并且没有任何接收错误:
ethtool -S eth2
NIC statistics:
rx_good_frames: 208
rx_broadcast_frames: 38
rx_multicast_frames: 208
rx_crc_error_frames: 0
rx_mii_error_frames: 0
我们需要确定传输路径会发生什么情况。
产生该问题的一个潜在原因是、如果 TX 时钟信号不是从 PHY 到 MAC、则发送数据包将恰好堆叠起来、最终驱动程序将超时。 请用示波器看看您是否在 TX 时钟线上看到时钟信号。
Pinmux 说明
我没有看到这个引脚复用的 信号:PRG0_PRU0_GPO8.PR0_MII0_RXLINK。看起来这个信号只是传入 EVM PHY 上的 LED、因此我预计这不会导致问题。
尽管您在器件文件中只启用了一个以太网接口、但看起来您正在为切片0 (PRU0、RTU0和 TX_PRE0驱动一个以太网接口)和切片1 (PRU1、RTU1和 TX_PRU1可驱动另一个以太网接口)执行引脚多路复用。 这是故意的吗?
其他一切看起来都很好。
当我使用 R5F 内核时、相应的以太网可以正常工作、TX 时钟信号也可用。 这是否意味着 Linux 环境中的这个时钟信号没有问题? 我 稍后将使用示波器来查看信号。
PRG0_PRU0_GPO8.PR0_MII0_RXLINK 我没有 添加他的定义、我稍后可以添加它、我认为您说得对、这部分不是影响以太网的原因。
片0 和片1 我已经在设备树中定义了它们、但实际上仅使用0、我稍后将对其进行修改。
我们使用 SDK8.06、是否需要执行任何相关操作?
有趣的是、您能够从 R5F 控制 PRU 以太网接口、并且工作正常。 我期待了解您是否在 Linux 环境中看到时钟信号(以及该信号是否与在 R5F 环境中观察到的信号有任何不同)。
我不希望您需要在 uboot 中应用 devicetre 覆盖文件。 只需使用该 devicetre 覆盖文件来修改基本 EVM.dts 文件、以便将以太网接口配置为 mii (因为它们在基本 EVM.dts 文件中配置为 RGMII - AM64x EVM 随附可配置为作为 RGMII 或 MII 运行的 PHY)。
但是、对于用例、您已经将 MII 设置直接写入电路板级.dts 文件。 我希望您不需要运行其他 uboot 命令。
"不支持的资源5"是预期的、不应影响互联网。
R5F 变化看起来不错。
我对内部延迟设置不是很熟悉-让我与一些团队成员核实一下。 如果我没有在星期四回复,请随意 ping 该线程。
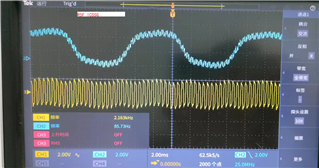
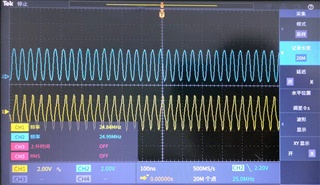
我用示波器检查 TX 时钟信号、发现它也存在。 我还将其与 RX 信号进行了比较。 我还使用实时内核 icssg 以太网执行 ping 操作、示波器捕获的时钟信号与 Linux 系统中的时钟信号一致。 我不 知道现在的问题是什么。 黄色是 TX CLK、蓝色是 RX CLK。
你(们)好
我发现了一个奇怪的问题。 我使用 phytool 命令、打印此、可能是什么问题?
示波器
您能否确认示波器采样率? 目前是62.5ksps 吗?
如果链路为100Mbit、则我预计时钟速度为12.5MHz。 因此、采样率需要大于每秒2500万个样本才能准确采集信号。
phytool 命令
我不确定我是否理解、该输出涉及哪个部分?
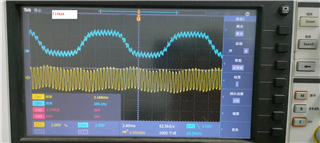
我 确认示波器采样率、然后修改采样率、在 MII 模式下、时钟速度应该是25MHz、实际上看到的 时钟速度是25MHz、是正确的。
我不知道 phytool 命令、如果 DP83620的 PHY 正常、 读取 BMCR 寄存器是否应为0xFFFF? 我刚刚在互联网上找到了这个命令并操作了它。 PHY 设置是否可能错误?
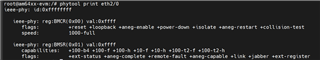
我更正了自己。 我在使用 phytool 命令时提供的地址错误。 我的 phy 地址为3、因此应该是 phytool print eth2/3、结果如下所示。
root@am64xx-EVM:~# phytool print eth2/3 IEEE-phy:id:0x20005ce1
IEEE-phy:reg:BMCR (0x00) val:0x3100 标志:-reset -loopback +aneg-enable -power-down -isolate -aneg-restart -collect-test 速度:100-全速
IEEE-phy:reg:BMSR (0x01) val:0x78c9 功能:-100-b4 +100-f +100-h +10-f +10-h -100-t2-f -100-t2-h 标志:-ext-status -aneg-complete -remote-fault +aneg-capable -link -Jabber +ext-register
这似乎正常。
内部延迟设置如何? 我想知道这些设置的含义。
有更新吗?
对这里的延迟答复深表歉意。 我一直在试图找另一位团队成员来讨论您的主题的详细信息、我们刚刚在周五和周一相互错过了。 将在明天提供另一个更新。
谢谢您告诉我。 我发现一个有趣的问题。 当我将"MII-g-rt =<&icssg0_MII_g_rt>;"更改为"ti、mII-g-rt =<&icssg_mII_g_rt>;"在 DTS 文件中、它将显示"icssg-prueth icssg0-rt :could not get MII-g-rt SYSCssg-rt SYSCII_g_rt;"、MicII_regti_rt ="&Micg_rt = 0;"、MicII_rt ="micg_rt =<&micg_rt; 这是什么? 我感到困惑。
时钟频率
我觉得100MBit 的- 25MHz TX 和 RX 时钟比我们预期的要高得多、这是个问题。
Devicetree 文件文档-使用您的内核版本中的文档
当我 为 Linux 内核5.10检查 Documentation/devicetree/bindings/net/ti、icssg-prueth.yaml 时、我看到使用了条目 MII-g-rt。 但是、当我检查 Linux 内核6.1时、我看到该条目已更改为名为 ti、mii-g-rt。 确保参考与您所使用的内核版本相关的内核文档版本。
PRU 固件
您能否确认 PRU 以太网固件位于何处? 您使用的是 SDK 8.6中提供的确切二进制文件还是不同的二进制文件?
Linux 驱动程序仅使用该 SDK 中打包的 PRU 二进制文件的确切版本进行测试。 如果使用不同 SDK 版本的二进制文件和 Linux 驱动程序、可能无法正常工作。
我确认内核版本是5.10、所以我使用 MII-g-RT。
"您能确认 PRU 以太网固件的位置吗? 您使用的是 SDK 8.6中提供的确切二进制文件还是不同的二进制文件?" 您的意思是文件"am64x-pru0_0-fw、am65x-sr2-pru0-prueth-Fw.elf"和其他相关文件? 我使用了用 SD 卡更新的原始映像、没有单独更改此文件。
此时还有其他可能吗? 我们的项目已经延迟了很长一段时间。
据我所知、一切都如我所料。 我并不了解其他任何调试方法-看起来您的硬件设计可能没问题、而且您的接收信号路径良好。 由于时钟信号看上去一切正常、因此似乎没有任何外部因素会阻塞 TX 路径。
下一步、我来看看我是否可以复制您在 AM64x EVM 上的观察结果、从而查看是否存在 Linux 软件问题。 我被告知 AM64x PRU 以太网 MII 应在8.6上运行、但我实际上尚未进行测试。
这可能需要几天,我道歉。 星期一是一个假期,所以如果我没有在星期二回复,可以随意的 ping 线程。
感谢您的跟进、到目前为止是否有任何结果?
有任何进展?
我已经等了一个星期了,有什么新消息吗?
您有任何结果吗?
对于持续的延误、我深表歉意。 我设置了一个测试板、然后生病了。 现在我正在返回工作岗位、但我的远程板设置发生了一些问题、所以我需要在明天对系统进行重置。 我将与开发人员讨论您的线程。
我很高兴收到您的回复、并希望尽快得到您的回复。
我有一点怀疑、可能是因为它与 MAC 地址有关、在初始化期间配置了随机 MAC、并且在使用 ifconfig 命令时显示的 MAC 地址与随机配置不一致。 我只是想,我不知道是否有任何联系。
验证:SDK 8.6上的 MII 可以在 AM64x EVM 上运行
我已在 AM64x EVM、SDK 8.6上确认、我能够将端口设置为 MII 模式、建立链路以及成功 ping 通主机。
一个有趣的注意事项是、我没有看到 ethtool -S 上出现了 TX 数据包、但我可以看到具有 ifconfig -a 的 TX 数据包 因此看起来至少在 MII 模式下、在 SDK 8.6上、ethtool -S 不能用作查看 TX 路径是否正常工作的工具。
root@am64xx-evm:~# uname -a
Linux am64xx-evm 5.10.168-g2c23e6c538 #1 SMP PREEMPT Mon Feb 27 14:16:24 UTC 2023 aarch64 aarch64 aarch64 GNU/Linux
root@am64xx-evm:~# dmesg | grep icss
[    9.341672] icssg-prueth icssg1-eth: TI PRU ethernet driver initialized: dual EMAC mode
[   12.026850] icssg-prueth icssg1-eth: settime timeout
[   15.128416] icssg-prueth icssg1-eth eth2: Link is Up - 100Mbps/Full - flow control off
root@am64xx-evm:~# ifconfig eth2 down
[  127.310811] icssg-prueth icssg1-eth eth2: Link is Down
[  127.317954] remoteproc remoteproc16: stopped remote processor 3008c000.txpru
[  127.325191] remoteproc remoteproc15: stopped remote processor 30086000.rtu
[  127.332172] remoteproc remoteproc14: stopped remote processor 300b8000.pru
[  127.341916] net eth2: stopped
root@am64xx-evm:~# ifconfig eth2 192.164
[  137.408130] remoteproc remoteproc14: powering up 300b8000.pru
[  137.414320] remoteproc remoteproc14: Booting fw image ti-pruss/am65x-sr2-pru1-prueth-fw.elf, size 38496
[  137.438744] remoteproc remoteproc14: unsupported resource 5
[  137.447916] remoteproc remoteproc14: remote processor 300b8000.pru is now up
[  137.457060] remoteproc remoteproc15: powering up 30086000.rtu
[  137.463373] remoteproc remoteproc15: Booting fw image ti-pruss/am65x-sr2-rtu1-prueth-fw.elf, size 30104
[  137.474404] remoteproc remoteproc15: remote processor 30086000.rtu is now up
[  137.481715] remoteproc remoteproc16: powering up 3008c000.txpru
[  137.488717] remoteproc remoteproc16: Booting fw image ti-pruss/am65x-sr2-txpru1-prueth-fw.elf, size 35836
[  137.498858] remoteproc remoteproc16: remote processor 3008c000.txpru is now up
[  137.509071] net eth2: started
[  140.568569] icssg-prueth icssg1-eth eth2: Link is Up - 100Mbps/Full - flow control off
[  140.576664] IPv6: ADDRCONF(NETDEV_CHANGE): eth2: link becomes ready
root@am64xx-evm:~# ping 192.168.1.100
PING 192.168.1.100 (192.168.1.100): 56 data bytes
64 bytes from 192.168.1.100: seq=0 ttl=64 time=0.996 ms
64 bytes from 192.168.1.100: seq=1 ttl=64 time=0.690 ms
64 bytes from 192.168.1.100: seq=2 ttl=64 time=0.631 ms
64 bytes from 192.168.1.100: seq=3 ttl=64 time=0.501 ms
64 bytes from 192.168.1.100: seq=4 ttl=64 time=0.632 ms
64 bytes from 192.168.1.100: seq=5 ttl=64 time=0.608 ms
64 bytes from 192.168.1.100: seq=6 ttl=64 time=0.663 ms
^C
--- 192.168.1.100 ping statistics ---
7 packets transmitted, 7 packets received, 0% packet loss
round-trip min/avg/max = 0.501/0.674/0.996 ms
root@am64xx-evm:~# ifconfig -a
...
eth2: flags=4163<UP,BROADCAST,RUNNING,MULTICAST>  mtu 1500  metric 1
        inet 192.168.1.164  netmask 255.255.255.0  broadcast 192.168.1.255
        inet6 fe80::72ff:76ff:fe1f:3b33  prefixlen 64  scopeid 0x20<link>
        ether 70:ff:76:1f:3b:33  txqueuelen 1000  (Ethernet)
        RX packets 50  bytes 8557 (8.3 KiB)
        RX errors 0  dropped 0  overruns 0  frame 0
        TX packets 77  bytes 11974 (11.6 KiB)
        TX errors 0  dropped 0 overruns 0  carrier 0  collisions 0
...
root@am64xx-evm:~# ethtool -S eth2
NIC statistics:
     rx_good_frames: 54
     rx_broadcast_frames: 21
     rx_multicast_frames: 45
     rx_crc_error_frames: 0
     rx_mii_error_frames: 0
     rx_odd_nibble_frames: 0
     rx_frame_max_size: 12000
     rx_max_size_error_frames: 0
     rx_frame_min_size: 384
     rx_min_size_error_frames: 0
     rx_overrun_frames: 0
     rx_class0_hits: 54
     rx_class1_hits: 0
     rx_class2_hits: 0
     rx_class3_hits: 0
     rx_class4_hits: 0
     rx_class5_hits: 0
     rx_class6_hits: 0
     rx_class7_hits: 0
     rx_class8_hits: 54
     rx_class9_hits: 54
     rx_class10_hits: 0
     rx_class11_hits: 0
     rx_class12_hits: 0
     rx_class13_hits: 0
     rx_class14_hits: 0
     rx_class15_hits: 0
     rx_smd_frags: 0
     rx_bucket1_size: 384
     rx_bucket2_size: 768
     rx_bucket3_size: 1536
     rx_bucket4_size: 3072
     rx_64B_frames: 6
     rx_bucket1_frames: 6
     rx_bucket2_frames: 24
     rx_bucket3_frames: 7
     rx_bucket4_frames: 17
     rx_bucket5_frames: 0
     rx_total_bytes: 9836
     rx_tx_total_bytes: 23210
     tx_good_frames: 0
     tx_broadcast_frames: 0
     tx_multicast_frames: 0
     tx_odd_nibble_frames: 0
     tx_underflow_errors: 0
     tx_frame_max_size: 12000
     tx_max_size_error_frames: 0
     tx_frame_min_size: 384
     tx_min_size_error_frames: 0
     tx_bucket1_size: 384
     tx_bucket2_size: 768
     tx_bucket3_size: 1536
     tx_bucket4_size: 3072
     tx_64B_frames: 0
     tx_bucket1_frames: 0
     tx_bucket2_frames: 0
     tx_bucket3_frames: 0
     tx_bucket4_frames: 0
     tx_bucket5_frames: 0
     tx_total_bytes: 0
我进行了仔细检查并将电路板设置为 RGMII 模式、ethtool -S 似乎确实正确地对数据包进行了计数。 这可能只是 MII 的问题。
MAC 地址?
我不确定这是否会有任何影响。 我会不停地问。
我看到了您的结果。 您使用了 icssg1、我使用了 icssg0、您使用的是双 MAC、我使用的是单 MAC。 我想区别就在这里。 如果 无法通过 ethtool -S 命令确认发送、是否有其他方法可以确定我的当前状态? 关于 MAC 地址、我认为它与此无关、因为在给它一个固定地址后也存在同样的问题。 当我像你一样关闭和再次打开以太网时,出现了以下消息:
root@am64xx-evm:~# uname -a
Linux am64xx-evm 5.10.168-g2c23e6c538 #1 SMP PREEMPT Thu Aug 22 08:45:07 CST 2024 aarch64 aarch64 aarch64 GNU/Linux
root@am64xx-evm:~# dmesg | grep icss
[    8.641057] icssg-prueth icssg0-eth: TI PRU ethernet driver initialized: single EMAC mode
[   14.249927] icssg-prueth icssg0-eth eth2: Link is Up - 100Mbps/Full - flow control off
root@am64xx-evm:~# ifconfig eth2 down
[   57.064804] icssg-prueth icssg0-eth eth2: Link is Down
[   57.089529] icssg-prueth icssg0-eth eth2: timeout waiting for command done
[   57.101261] remoteproc remoteproc5: stopped remote processor 3000a000.txpru
[   57.108411] remoteproc remoteproc3: stopped remote processor 30004000.rtu
[   57.115400] remoteproc remoteproc2: stopped remote processor 30034000.pru
[   57.125183] net eth2: stopped
root@am64xx-evm:~# [   60.114329] Unable to handle kernel NULL pointer dereference at virtual address 0000000000000018
[   60.123117] Mem abort info:
[   60.125901]   ESR = 0x96000006
[   60.128945]   EC = 0x25: DABT (current EL), IL = 32 bits
[   60.134244]   SET = 0, FnV = 0
[   60.137288]   EA = 0, S1PTW = 0
[   60.140418] Data abort info:
[   60.143288]   ISV = 0, ISS = 0x00000006
[   60.147112]   CM = 0, WnR = 0
[   60.150072] user pgtable: 4k pages, 48-bit VAs, pgdp=0000000085da7000
[   60.156497] [0000000000000018] pgd=0000000085fab003, p4d=0000000085fab003, pud=0000000085e94003, pmd=0000000000000000
[   60.167099] Internal error: Oops: 96000006 [#1] PREEMPT SMP
[   60.172658] Modules linked in: wlcore_sdio wl18xx wlcore mac80211 cfg80211 rfkill libarc4 cdns3 udc_core roles usbcore usb_common rpmsg_char irq_pruss_intc icssg_prueth crct10dif_ce pru_rproc icss_iep phy_can_transceiver cdns3_ti rti_wdt ti_k3_r5_remoteproc virtio_rpmsg_bus ti_k3_m4_remoteproc sa2ul sha512_generic pruss authenc rtc_ds1307 m_can_platform m_can at24 can_dev optee_rng rng_core sch_fq_codel ipv6
[   60.208861] CPU: 0 PID: 557 Comm: irqbalance Not tainted 5.10.168-g2c23e6c538 #1
[   60.216237] Hardware name: Texas Instruments AM642 EVM (DT)
[   60.221798] pstate: 60000085 (nZCv daIf -PAN -UAO -TCO BTYPE=--)
[   60.227803] pc : ti_sci_inta_set_affinity+0x88/0xf8
[   60.232670] lr : ti_sci_inta_set_affinity+0x88/0xf8
[   60.237534] sp : ffff800011d3bbe0
[   60.240838] x29: ffff800011d3bbe0 x28: ffff000000385580
[   60.246141] x27: 0000000000000000 x26: 0000000000000000
[   60.251443] x25: 0000000000000000 x24: ffff8000111bb7f8
[   60.256746] x23: ffff000001576000 x22: 0000000000000000
[   60.262049] x21: ffff000001527100 x20: ffff000004999c0c
[   60.267351] x19: ffff800011260af8 x18: 0000000000000000
[   60.272654] x17: 0000000000000000 x16: 0000000000000000
[   60.277956] x15: 0000000033e121d0 x14: 0000000000000000
[   60.283258] x13: 0000000000000000 x12: 0000000000000000
[   60.288560] x11: 0000000000000040 x10: ffff8000111a0790
[   60.293863] x9 : ffff8000111a0788 x8 : ffff000000400270
[   60.299165] x7 : 0000000000000000 x6 : 0000000000000000
[   60.304468] x5 : ffff000000400248 x4 : ffff000000400270
[   60.309769] x3 : 0000000000000000 x2 : 0000000000000000
[   60.315071] x1 : 0000000000000060 x0 : 0000000000000000
[   60.320375] Call trace:
[   60.322817]  ti_sci_inta_set_affinity+0x88/0xf8
[   60.327338]  msi_domain_set_affinity+0x40/0xb8
[   60.331773]  irq_do_set_affinity+0x174/0x220
[   60.336033]  irq_set_affinity_locked+0xc8/0x1d8
[   60.340552]  __irq_set_affinity+0x48/0x78
[   60.344552]  write_irq_affinity.isra.0+0xf8/0x118
[   60.349245]  irq_affinity_proc_write+0x24/0x30
[   60.353680]  proc_reg_write+0xa8/0x100
[   60.357423]  vfs_write+0xc0/0x368
[   60.360730]  ksys_write+0x6c/0xf8
[   60.364035]  __arm64_sys_write+0x1c/0x28
[   60.367951]  el0_svc_common.constprop.0+0x78/0x1c8
[   60.372730]  do_el0_svc+0x24/0xa0
[   60.376039]  el0_svc+0x14/0x20
[   60.379084]  el0_sync_handler+0xb0/0xb8
[   60.382912]  el0_sync+0x180/0x1c0
[   60.386222] Code: a9410e62 a9048c02 b9432280 97eeec0f (f9400c01)
[   60.392305] ---[ end trace 68fe0c2d52662d78 ]---
[   60.396914] note: irqbalance[557] exited with preempt_count 2
2024 Sep 11 08:18:09 am64xx-evm [   60.114329] Unable to handle kernel NULL pointer dereference at virtual address 0000000000000018
2024 Sep 11 08:18:09 am64xx-evm [   60.123117] Mem abort info:
2024 Sep 11 08:18:09 am64xx-evm [   60.125901]   ESR = 0x96000006
2024 Sep 11 08:18:09 am64xx-evm [   60.128945]   EC = 0x25: DABT (current EL), IL = 32 bits
2024 Sep 11 08:18:09 am64xx-evm [   60.134244]   SET = 0, FnV = 0
2024 Sep 11 08:18:09 am64xx-evm [   60.137288]   EA = 0, S1PTW = 0
2024 Sep 11 08:18:09 am64xx-evm [   60.140418] Data abort info:
2024 Sep 11 08:18:09 am64xx-evm [   60.143288]   ISV = 0, ISS = 0x00000006
2024 Sep 11 08:18:09 am64xx-evm [   60.147112]   CM = 0, WnR = 0
2024 Sep 11 08:18:09 am64xx-evm [   60.150072] user pgtable: 4k pages, 48-bit VAs, pgdp=0000000085da7000
2024 Sep 11 08:18:09 am64xx-evm [   60.156497] [0000000000000018] pgd=0000000085fab003, p4d=0000000085fab003, pud=0000000085e94003, pmd=0000000000000000
2024 Sep 11 08:18:09 am64xx-evm [   60.167099] Internal error: Oops: 96000006 [#1] PREEMPT SMP
2024 Sep 11 08:18:09 am64xx-evm [   60.386222] Code: a9410e62 a9048c02 b9432280 97eeec0f (f9400c01)
2024 Sep 11 08:18:09 am64xx-evm Unable to handle kernel NULL pointer dereference at virtual address 0000000000000018
2024 Sep 11 08:18:09 am64xx-evm Mem abort info:
2024 Sep 11 08:18:09 am64xx-evm   ESR = 0x96000006
2024 Sep 11 08:18:09 am64xx-evm   EC = 0x25: DABT (current EL), IL = 32 bits
2024 Sep 11 08:18:09 am64xx-evm   SET = 0, FnV = 0
2024 Sep 11 08:18:09 am64xx-evm   EA = 0, S1PTW = 0
2024 Sep 11 08:18:09 am64xx-evm Data abort info:
2024 Sep 11 08:18:09 am64xx-evm   ISV = 0, ISS = 0x00000006
2024 Sep 11 08:18:09 am64xx-evm   CM = 0, WnR = 0
2024 Sep 11 08:18:09 am64xx-evm user pgtable: 4k pages, 48-bit VAs, pgdp=0000000085da7000
2024 Sep 11 08:18:09 am64xx-evm [0000000000000018] pgd=0000000085fab003, p4d=0000000085fab003, pud=0000000085e94003, pmd=0000000000000000
2024 Sep 11 08:18:09 am64xx-evm Internal error: Oops: 96000006 [#1] PREEMPT SMP
2024 Sep 11 08:18:09 am64xx-evm Code: a9410e62 a9048c02 b9432280 97eeec0f (f9400c01)
[  131.772802] Initializing XFRM netlink socket
[  132.878952] bridge: filtering via arp/ip/ip6tables is no longer available by default. Update your scripts to load br_netfilter if you need this.
[  132.907379] Bridge firewalling registered
[  134.290875] process 'docker/tmp/qemu-check434749947/check' started with executable stack
我也发现不同的,你有"设定时间超时",我的没有。
链路断开错误
我还在 MII 链路断开时偶尔观察到相同的行为:
am64xx-evm login: root
root@am64xx-evm:~# ifconfig eth2 down
[   35.562946] icssg-prueth icssg1-eth eth2: Link is Down
[   35.570132] remoteproc remoteproc16: stopped remote processor 3008c000.txpru
[   35.580760] remoteproc remoteproc15: stopped remote processor 30086000.rtu
[   35.590055] remoteproc remoteproc14: stopped remote processor 300b8000.pru
[   35.601336] net eth2: stopped
root@am64xx-evm:~# ifconfig eth2 192.168.[   41.105204] Unable to handle kernel NULL pointer dereference at virtual address 0000000000000018
[   41.113992] Mem abort info:
[   41.116776]   ESR = 0x96000006
[   41.119821]   EC = 0x25: DABT (current EL), IL = 32 bits
[   41.125117]   SET = 0, FnV = 0
[   41.128160]   EA = 0, S1PTW = 0
[   41.131289] Data abort info:
[   41.134159]   ISV = 0, ISS = 0x00000006
[   41.137982]   CM = 0, WnR = 0
[   41.140942] user pgtable: 4k pages, 48-bit VAs, pgdp=0000000086699000
[   41.147367] [0000000000000018] pgd=00000000857fa003, p4d=00000000857fa003, pud=000000008644e003, pmd=0000000000000000
[   41.157968] Internal error: Oops: 96000006 [#1] PREEMPT SMP
[   41.163526] Modules linked in: wlcore_sdio wl18xx wlcore mac80211 cfg80211 rfkill libarc4 cdns3 udc_core roles usbcore usb_common rpmsg_char irq_pruss_intc crct10dif_ce i
cssg_prueth pru_rproc icss_iep ti_k3_r5_remoteproc pci_endpoint_test phy_can_transceiver cdns3_ti virtio_rpmsg_bus rti_wdt ti_k3_m4_remoteproc sa2ul sha512_generic authenc p
russ m_can_platform m_can can_dev optee_rng rng_core eeprom_93xx46 sch_fq_codel cryptodev(O) ipv6
[   41.202248] CPU: 1 PID: 618 Comm: irqbalance Tainted: G           O      5.10.168-g2c23e6c538 #1
[   41.211011] Hardware name: Texas Instruments AM642 EVM (DT)
[   41.216574] pstate: 60000085 (nZCv daIf -PAN -UAO -TCO BTYPE=--)
[   41.222582] pc : ti_sci_inta_set_affinity+0x88/0xf8
[   41.227451] lr : ti_sci_inta_set_affinity+0x88/0xf8
[   41.232315] sp : ffff8000120b3be0
[   41.235618] x29: ffff8000120b3be0 x28: ffff0000066c0e40
[   41.240921] x27: 0000000000000000 x26: 0000000000000000
[   41.246223] x25: 0000000000000000 x24: ffff8000111cb7f8
[   41.251526] x23: ffff0000015a3a00 x22: 0000000000000000
[   41.256829] x21: ffff00000158a700 x20: ffff000004293c00
[   41.262131] x19: ffff800011270af8 x18: 0000000000000000
[   41.267434] x17: 0000000000000000 x16: 0000000000000000
[   41.272737] x15: 000000002037d1d0 x14: 0000000000000000
[   41.278040] x13: 0000000000000000 x12: 0000000000000000
[   41.283342] x11: 0000000000000040 x10: ffff8000111b0790
[   41.288645] x9 : ffff8000111b0788 x8 : ffff000000679b88
[   41.293947] x7 : 0000000000000000 x6 : 0000000000000000
[   41.299249] x5 : ffff000000679b60 x4 : ffff000000679ca0
[   41.304551] x3 : 0000000000000000 x2 : 0000000000000000
[   41.309854] x1 : 0000000000000060 x0 : 0000000000000000
[1   41.315157] Call trace:
[   41.317688]  ti_sci_inta_set_affinity+0x88/0xf8
[   41.322210]  msi_domain_set_affinity+0x40/0xb8
[   41.326646]  irq_do_set_affinity+0x174/0x220
[   41.330905]  irq_set_affinity_locked+0xc8/0x1d8
[   41.335424]  __irq_set_affinity+0x48/0x78
[   41.339424]  write_irq_affinity.isra.0+0xf8/0x118
[   41.344117]  irq_affinity_proc_write+0x24/0x30
[   41.348552]  proc_reg_write+0xa8/0x100
[   41.352294]  vfs_write+0xc0/0x368
[   41.355600]  ksys_write+0x6c/0xf8
[   41.358906]  __arm64_sys_write+0x1c/0x28
[   41.362822]  el0_svc_common.constprop.0+0x78/0x1c8
[   41.367602]  do_el0_svc+0x24/0xa0
[   41.370911]  el0_svc+0x14/0x20
[   41.373957]  el0_sync_handler+0xb0/0xb8
[   41.377784]  el0_sync+0x180/0x1c0
[   41.381095] Code: a9410e62 a9048c02 b9432280 97eeec0f (f9400c01)
[   41.387178] ---[ end trace 24aa68ec3b3788c2 ]---
[   41.391788] note: irqbalance[618] exited with preempt_count 2
.2023 Feb 27 13:25:53 am64xx-evm [   41.105204] Unable to handle kernel NULL pointer dereference at virtual address 0000000000000018
2023 Feb 27 13:25:53 am64xx-evm [   41.113992] Mem abort info:
2023 Feb 27 13:25:53 am64xx-evm [   41.116776]   ESR = 0x96000006
2023 Feb 27 13:25:53 am64xx-evm [   41.119821]   EC = 0x25: DABT (current EL), IL = 32 bits
2023 Feb 27 13:25:53 am64xx-evm [   41.125117]   SET = 0, FnV = 0
2023 Feb 27 13:25:53 am64xx-evm [   41.128160]   EA = 0, S1PTW = 0
2023 Feb 27 13:25:53 am64xx-evm [   41.131289] Data abort info:
2023 Feb 27 13:25:53 am64xx-evm [   41.134159]   ISV = 0, ISS = 0x00000006
2023 Feb 27 13:25:53 am64xx-evm [   41.137982]   CM = 0, WnR = 0
2023 Feb 27 13:25:53 am64xx-evm [   41.140942] user pgtable: 4k pages, 48-bit VAs, pgdp=0000000086699000
2023 Feb 27 13:25:53 am64xx-evm [   41.147367] [0000000000000018] pgd=00000000857fa003, p4d=00000000857fa003, pud=000000008644e003, pmd=0000000000000000
2023 Feb 27 13:25:53 am64xx-evm [   41.157968] Internal error: Oops: 96000006 [#1] PREEMPT SMP
2023 Feb 27 13:25:53 am64xx-evm [   41.381095] Code: a9410e62 a9048c02 b9432280 97eeec0f (f9400c01)
12023 Feb 27 13:25:53 am64xx-evm Unable to handle kernel NULL pointer dereference at virtual address 0000000000000018
2023 Feb 27 13:25:53 am64xx-evm Unable to handle kernel NULL pointer dereference at virtual address 0000000000000018
2023 Feb 27 13:25:53 am64xx-evm Mem abort info:
2023 Feb 27 13:25:53 am64xx-evm   ESR = 0x96000006
2023 Feb 27 13:25:53 am64xx-evm   EC = 0x25: DABT (current EL), IL = 32 bits
2023 Feb 27 13:25:53 am64xx-evm   SET = 0, FnV = 0
2023 Feb 27 13:25:53 am64xx-evm   EA = 0, S1PTW = 0
2023 Feb 27 13:25:53 am64xx-evm Data abort info:
2023 Feb 27 13:25:53 am64xx-evm   ISV = 0, ISS = 0x00000006
2023 Feb 27 13:25:53 am64xx-evm   CM = 0, WnR = 0
2023 Feb 27 13:25:53 am64xx-evm user pgtable: 4k pages, 48-bit VAs, pgdp=0000000086699000
2023 Feb 27 13:25:53 am64xx-evm [0000000000000018] pgd=00000000857fa003, p4d=00000000857fa003, pud=000000008644e003, pmd=0000000000000000
2023 Feb 27 13:25:53 am64xx-evm Internal error: Oops: 96000006 [#1] PREEMPT SMP
2023 Feb 27 13:25:53 am64xx-evm Code: a9410e62 a9048c02 b9432280 97eeec0f (f9400c01)
我想问开发人员、此 SDK 版本是否会出现这种情况。
有什么关于验证 TX 路径的建议吗?
如果您能够 ping 通其他内容、或被其他内容 Ping、这应该是一个很好的指示。 ifconfig -A 还提供了似乎对我合理的 TX 数据包计数。
例如、我 在前一个响应中显示了我要在本地网络上进行的测试、在本地网络中、我已将静态 IP 地址192.168.1.XXX 分配给 EVM 和我的 PC。
我目前使用 ifconfig -A 命令、TX 和 RX 数据包都在那里、但我 无法对计算机执行 ping 操作。 我还使用静态 IP、PC 地址为192.168.5.253、EVM 设置为192.168.5.32。
我想知道 为什么它出现"icssg-prueth icssg0-eth eth2:Xmit timeout"?
我使用 icssg0、您使用 icssg1、有什么区别?
如何知道我使用的是哪个 PHY 驱动程序? 我正在使用的当前芯片是 DP83620、它的 ID 应该为0x20005ce1。 这也是我通过 phytool 命令读出的值、但是、打印时打印的 PHY 相关信息为" Davinci_MDIO 30032400.MDIO:PHY[3]:device 30032400.MDIO:03、driver TI DP83620 10/100Mbps PHY"、我在 DP83848.c 文件中看到了此名称、但此文件中定义 的 ID 为0x20005ce0。我认为此驱动程序不应与 MII PHY 上的通用驱动程序匹配、但我认为此驱动程序不匹配。 我对这部分有疑问。 您能否详细解释查找相应驱动程序的过程?
DP83848.C

#define TI_DP83848C_PHY_ID		0x20005ca0
#define TI_DP83620_PHY_ID		0x20005ce0
#define NS_DP83848C_PHY_ID		0x20005c90
#define TLK10X_PHY_ID			0x2000a210

static struct phy_driver dp83848_driver[] = {
	DP83848_PHY_DRIVER(TI_DP83848C_PHY_ID, "TI DP83848C 10/100 Mbps PHY",
			   NULL),
	DP83848_PHY_DRIVER(NS_DP83848C_PHY_ID, "NS DP83848C 10/100 Mbps PHY",
			   NULL),
	DP83848_PHY_DRIVER(TI_DP83620_PHY_ID, "TI DP83620 10/100 Mbps PHY",
			   dp83848_config_init),
	DP83848_PHY_DRIVER(TLK10X_PHY_ID, "TI TLK10X 10/100 Mbps PHY",
			   NULL),
};

Use phytool command to check phy ID
root@am64xx-evm:~# phytool print eth2/3/2
ieee-phy: reg:0x02 val:0x2000
root@am64xx-evm:~# phytool print eth2/3/3
ieee-phy: reg:0x03 val:0x5ce1
我有两个问题、希望您能回答所有问题。
此致!
为什么要打印以下信息?
[131.748943]初始化 XFRM netlink 套接字 [ 132.846054]网桥:通过 arp/ip/ip6tables 过滤的默认情况下不再可用。 更新脚本以加载 br_netfil [ 132.862837]桥墙已注册 [134.250585]使用可执行堆栈启动进程"docker/tmp/qemu-check368786963/check"
它会产生什么影响? 我需要对此做些什么吗?
我将向 PHY 团队发送您的线程、以讨论有关 PHY 驱动程序的问题、看看他们是否有任何其他建议。 完成后、他们会将该线程重新分配给我。