This thread has been locked.

If you have a related question, please click the "Ask a related question" button in the top right corner. The newly created question will be automatically linked to this question.

[参考译文] IWR6843AOPEVM:通过人员跟踪演示了解生命体征中存储数据的可视化步骤

Guru**** 2463330 points


请注意,本文内容源自机器翻译,可能存在语法或其它翻译错误,仅供参考。如需获取准确内容,请参阅链接中的英语原文或自行翻译。

https://e2e.ti.com/support/sensors-group/sensors/f/sensors-forum/1485140/iwr6843aopevm-visualization-steps-for-data-stored-in-the-vital-signs-with-people-tracking-demo

器件型号:IWR6843AOPEVM

工具与软件:

大家好!

我想使用" Vital_Signs_With_People_Tracking 从" RADAR_toolbox_2_30_00_12" 以存储测试数据并编写程序来读取存储的数据。

在我的上一个问题中:
https://e2e.ti.com/support/sensors-group/sensors/f/sensors-forum/1481724/iwr6843aopevm-can-display-both-heart-rate-and-the-range-azimuth-heatmap-simultaneously/5693086#5693086
我提到、我希望同时检测生命体征并显示 距离-方位角热图 但我收到的答复表明、这是不可能的。

使用存储的检测数据执行可视化是否可行?
是否有任何示例代码可用于将存储的数据转换为 距离-方位角热图

感谢您的回复!

  • 请注意,本文内容源自机器翻译,可能存在语法或其它翻译错误,仅供参考。如需获取准确内容,请参阅链接中的英语原文或自行翻译。

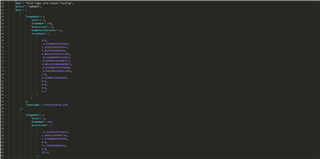
    存儲在後端的數據就像圖中所示的那樣。μ A