This thread has been locked.
If you have a related question, please click the "Ask a related question" button in the top right corner. The newly created question will be automatically linked to this question.
https://e2e.ti.com/support/sensors-group/sensors/f/sensors-forum/620553/awr1642boost-the-angle-of-x-y-scatter-plot-of-demo-visualizer
您好!
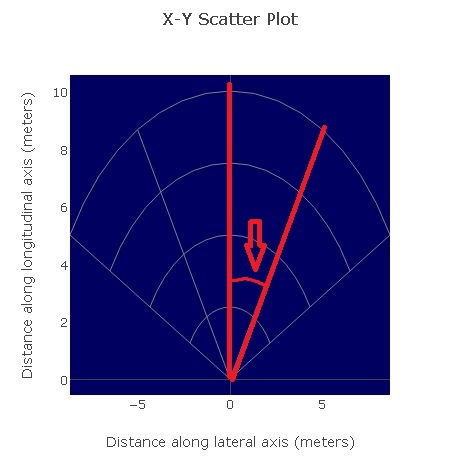
请告诉我下图中绘制的角度。 角度信息用于评估 AWR1642BOOST。 我想角度是27.5度。
此致、
Nomo
您好、Nomo-San、
每个电弧的角度为 PI/6弧度或30度。 您可以通过按 F12 (或 如本主题中所述)查看可视化工具的源代码、然后查看文件 app/mmwave.js。 X-Y 散射图角度在以下代码中设置。
}否则{
VAR 网格选择='polar 网格2';
var rectgrid = gridchoice ='reCT grid';
模板对象$.ti_widget_Plot1.data =[
{type:'statter'、mode:'makers'、
标记:{size:4、color:'RGB (0、255、0)'、showscale:false}
}
];
templateObj.$.ti_widget_Plot1.layout.title ='X-Y 散点图';
删除 templateObj.$.ti_widget_Plot1.layout.margin;
模板对象$.ti_widget_plot1.layout.plot_bgcolor ='RGB (0、0、96)';
templateObj.$.ti_widget_Plot1.layout.xaxis ={
标题:"沿横向轴(米)的距离"、
showgrid:rectgrid、
//zerolinecolor:'RGB (128、128、128)'、
自动范围:false、
范围:[-range_width、range_width]
};
templateObj.$.ti_widget_Plot1.layout.yaxis ={
标题:"纵轴(米)的间距"、
showgrid:rectgrid、
自动范围:false、
范围:[0、RANGE_DEPTY]
};
VAR 半径=[];
VAR 角度=[];
if (gridChoice =='polar grid 1'){
radi.PUSH (range_depth);
angles.push ( math.pi/6+0*math.pi*2/12);
angles.push (math.pi/6 + 4*math.pi*2/12);
} 否则、如果(网格选择='polar grid 2'){
对于(var i=1;i<=4;i++){
radi.push (i*range_depth/4);
}
对于(var i=0;i<5;i++、idx+=1){
//if (i=2)继续;//跳过主垂直线
angles.push (math.pi/6 + i*math.pi*2/12);
}
}
您还可以从 https://dev.ti.com/gallery 下载 Visualizer 源代码。 单击 MMWAVE_DEMO-VISUALIZER 下的下载按钮、然后下载适用于您的平台的 zip 文件。
此致
尼廷
您好、Nitin - San、
感谢你的答复。 您的答案很有帮助。