This thread has been locked.
If you have a related question, please click the "Ask a related question" button in the top right corner. The newly created question will be automatically linked to this question.
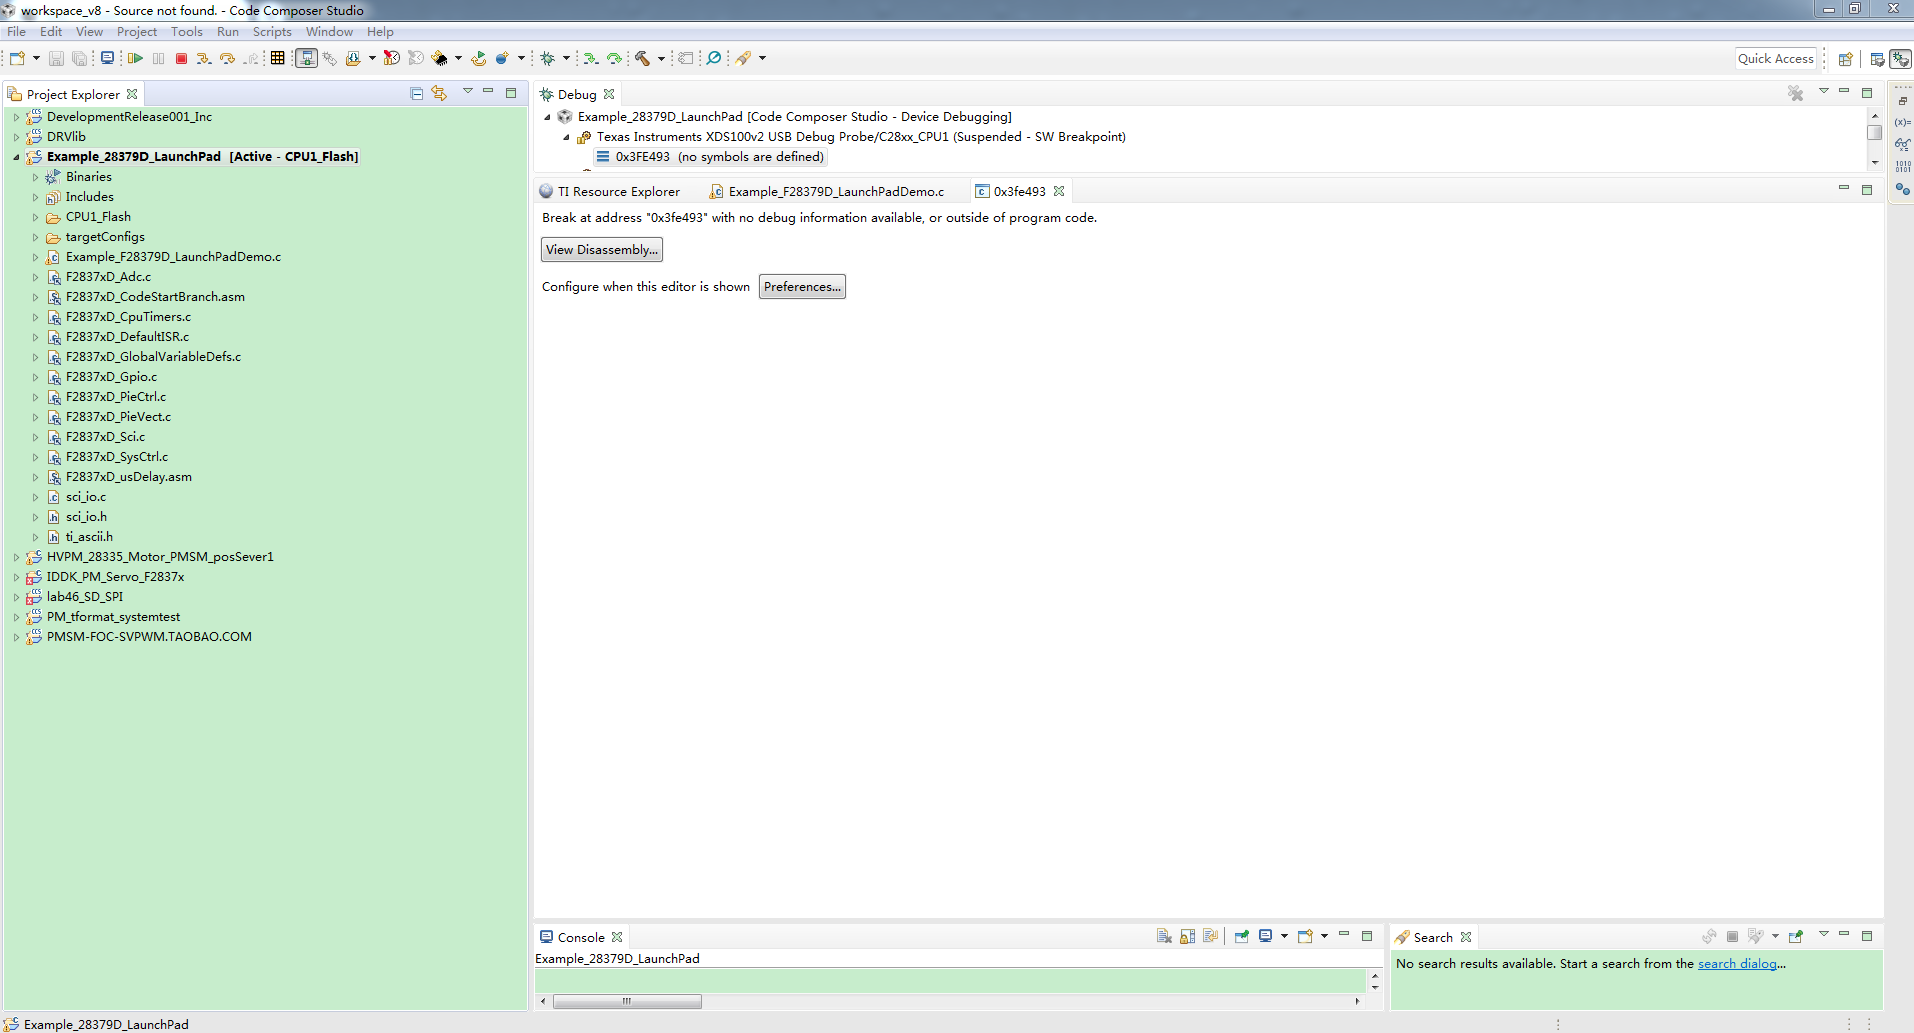
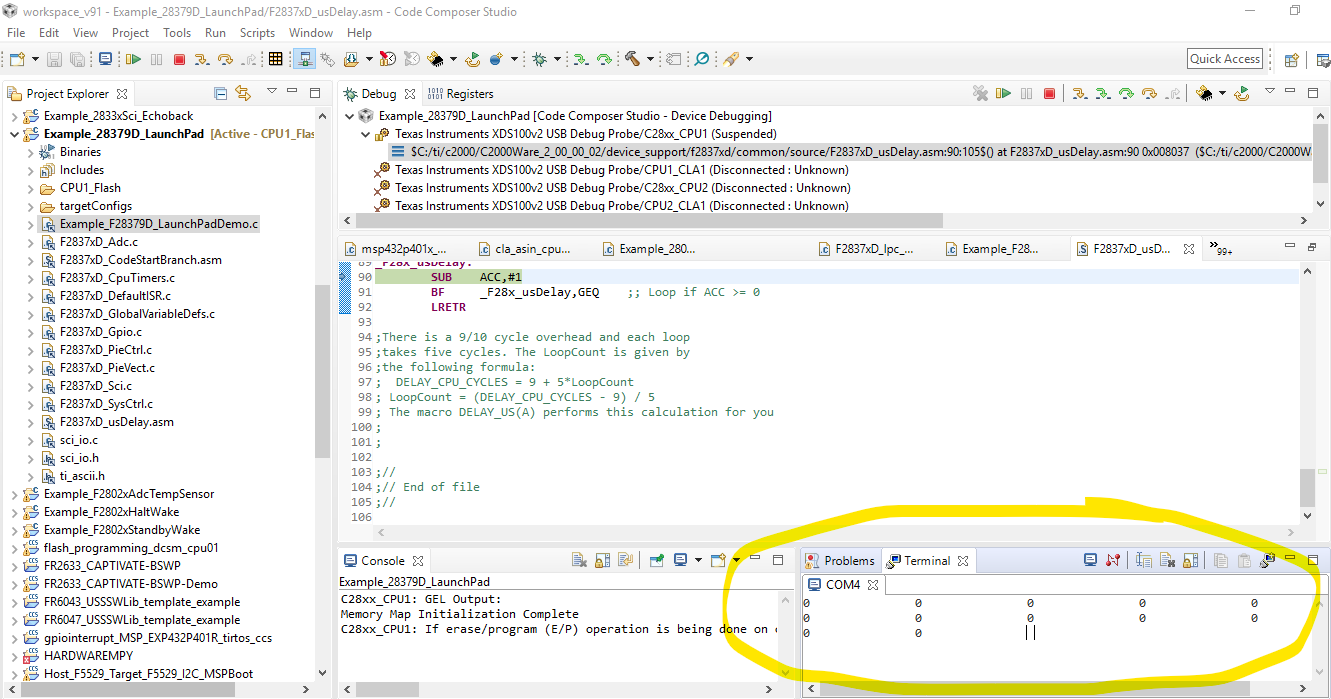
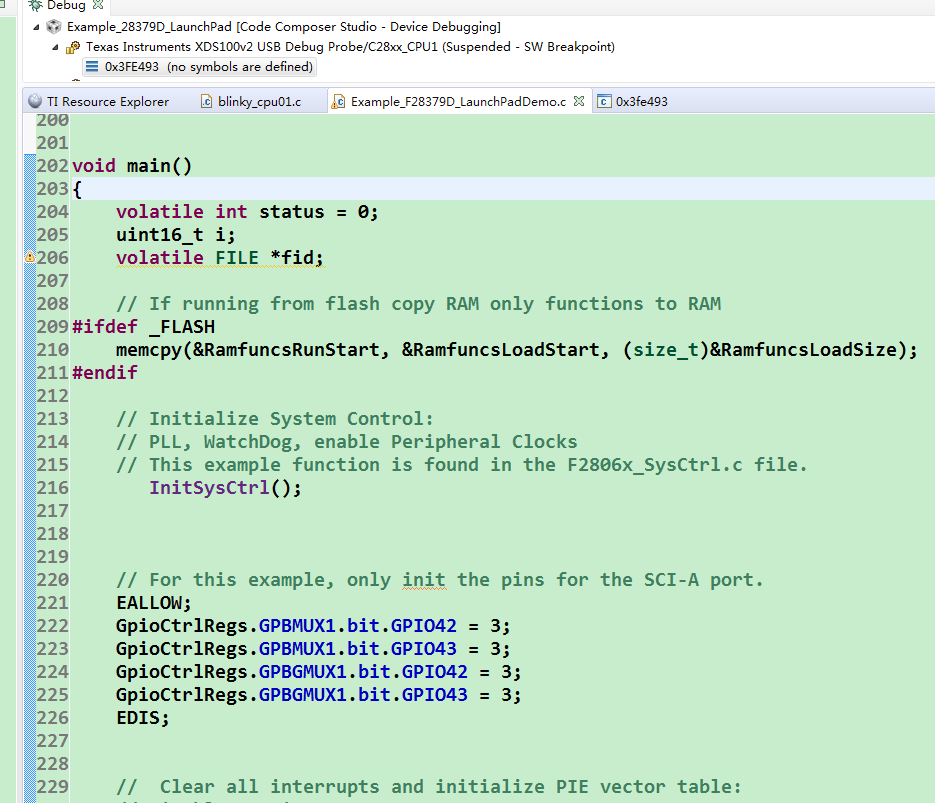
您好,我也遇到了和别人类似的问题:仿真时跳转到“Break at address "0x3fe493" with no debug information available, or outside of program code.”,不能单步运行,请问应该怎样处理呢?我用的是TI公司的C2000 LaunchPad XL开发板,芯片是28379D,VER2.0。
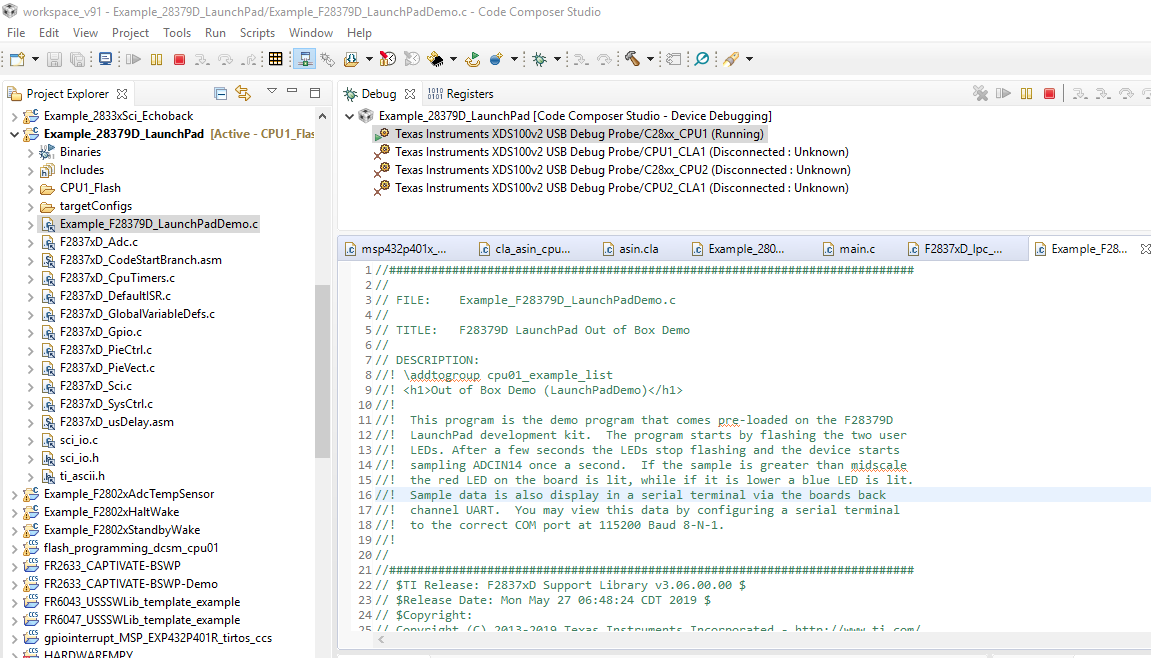
开发板刚打开运行里面的自带程序时是没有问题的,之后我按照user's guide中的指导,在CCS中下载了28379_LaunchPad的例程并烧写进芯片以后,就出现了上述问题,请问应该如何解决?
多谢!!!
我测试了一下,是可以正常运行的。如下图
且该程序说明如下
This program is the demo program that comes pre-loaded on the F28379D
//! LaunchPad development kit. The program starts by flashing the two user
//! LEDs. After a few seconds the LEDs stop flashing and the device starts
//! sampling ADCIN14 once a second. If the sample is greater than midscale
//! the red LED on the board is lit, while if it is lower a blue LED is lit.
//! Sample data is also display in a serial terminal via the boards back
//! channel UART. You may view this data by configuring a serial terminal
//! to the correct COM port at 115200 Baud 8-N-1.
只有开始几秒会闪烁,之后会每秒一次采集sampling ADCIN14
脱离在线调试后,我断电重启了一下,和之前的结果是相同的