Other Parts Discussed in Thread: AWR1642,
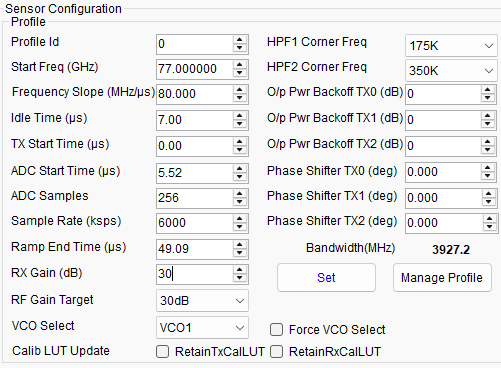
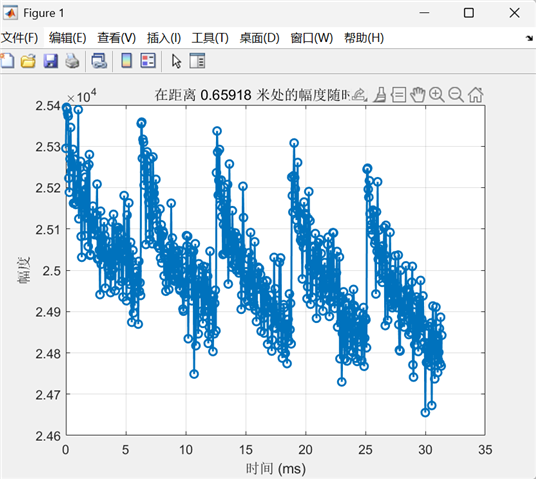
 I used AWR1642+DCA1000 to detect liquids from stationary objects, and the parameters set in mmWaveStudio were as follows: 128 chirp, 1 frame. After receiving the data, the FFT transformation of the data was carried out, and 30 times of detection, and it was found that the amplitude of the corresponding position of the FFT transformation (R-A) graph showed a downward trend in these 30 times, why is this? Later, it was changed to 5 frames, and the result is shown in the figure below, I would like to ask what caused this?
