This thread has been locked.

If you have a related question, please click the "Ask a related question" button in the top right corner. The newly created question will be automatically linked to this question.

DS90UB948-Q1: Analysis of eye chart test results

Part Number: DS90UB948-Q1

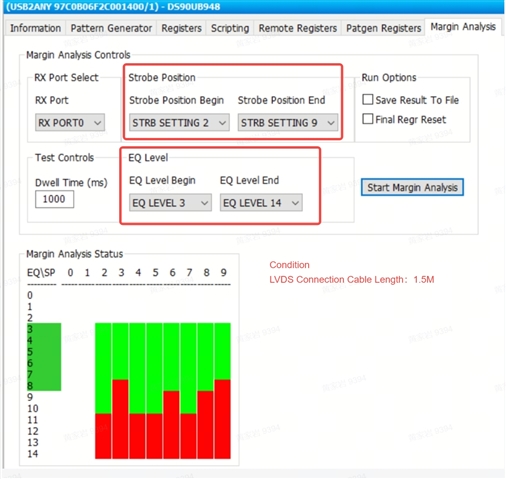
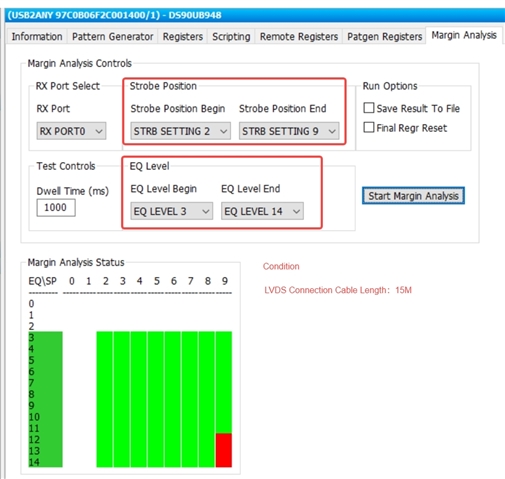
Test the quality of the eye diagram under different LVDS signal cable length conditions: test experiment 1 and test experiment 2 set the same EQ level range and the same STROBE position range, the test results are not what I expected, why is it that the longer the length of the LVDS signal cable, the better the quality of the eye diagram, and the shorter the length of the LVDS signal cable connection. The test results are as follows. In addition, I would like to know what parameters are used to judge the eye diagram results, and whether they are related to the EQ and the strobe position values? What is the relationship between them?


  • Hi,

    Could you please share the lengths of the cables for experiments 1 and 2? In addition, could you share the cable type(s) used for the application, and the connector type as well? I am anticipating that the better results of the experiment 2 can be attributed to the equalization levels ->

    • Higher equalization levels with shorter cables can amplify noise on the link compared to the attenuated signals over a longer length (this may be the behavior at equalization levels 9 and beyond from the first test)

    You can also check this test again by changing the equalization levels from 0 to 9 and check if the results are consistent across both tests.